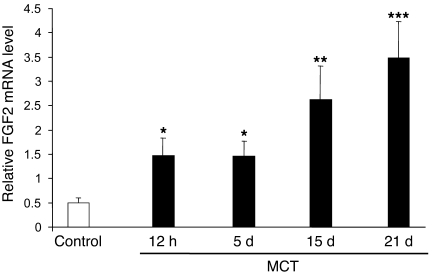
Figure 4. Lung FGF2 expression in MCT-induced PH.
Kinetics of FGF2 mRNA levels measured by real-time quantitative PCR over a 21-day period in lungs of rats (n = 5 in each group) injected s.c. with MCT (60 mg/kg). *P < 0.05; **P < 0.01; ***P < 0.001 vs. control rats injected with saline instead of MCT.

