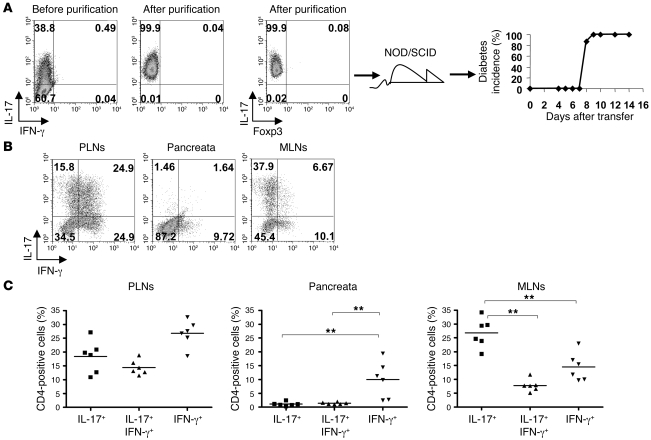
Figure 4. Purified Th17 T cells convert in vivo.
(A) FACS plots of tetramer staining for IL-17 versus IFN-γ before (left dot plot) or after (middle dot plot) purification. IL-17 versus Foxp3 profile of purified cells (right dot plot). Diabetes onset in NOD/SCID recipients of highly purified Th17 cells (filled diamonds) (right panel). Numbers indicate the percentage of cells in each quadrant. (B) Representative FACS plots gated on CD4+Vβ4+ T cells from PLNs, pancreata, and mesenteric lymph nodes (MLNs) 8 days after transfer of highly purified Th17 cells, showing IL-17 versus IFN-γ intracellular staining. Numbers indicate the percentage of cells in each quadrant (A and B). (C) Summary graphs showing the percentage of cells producing IL-17, IL-17 plus IFN-γ, or IFN-γ alone. Horizontal bars represent mean percentage of CD4+ cells positive for stated cytokines from 6 samples, and individual symbols represent percentage of CD4+ cells positive for stated cytokines for individual mice. **P < 0.01, Mann-Whitney U test (n = 6). These data are representative of 3 independent experiments.

