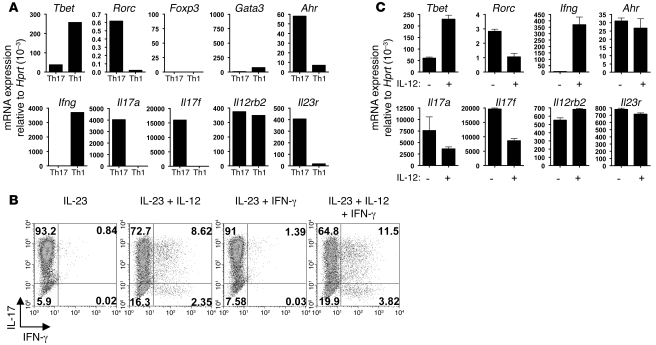
Figure 5. In vitro conversion of highly purified Th17 cells.
(A) mRNA expression relative to Hprt for stated transcription factors, cytokines, and receptors, comparing highly purified Th17 cells and Th1 cells. (B) Representative FACS plot showing intracellular staining of highly purified Th17 cells, cultured in the presence of IL-23 and the cytokines indicated, on day 3 following purification. Numbers indicate the percentage of cells in each quadrant. (C) mRNA expression relative to Hprt, comparing highly purified Th17 cells cultured with IL-23, with (+) or without (–) IL-12, for stated transcription factors, cytokines, and receptors. Mean ± SEM.

