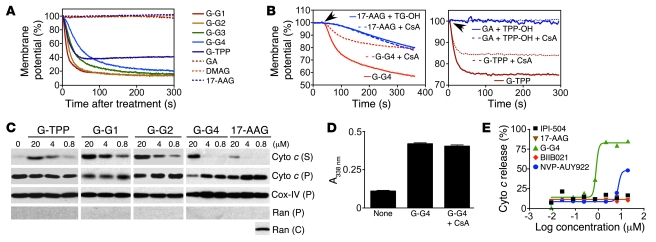
Figure 3. Mitochondrial dysfunction.
(A) Mitochondrial membrane depolarization. Tetramethylrhodamine methyl ester–loaded (TMRM-loaded) HeLa cell mitochondria treated with Gamitrinibs or the various indicated agents (1 μM) were analyzed for changes in fluorescence emission. (B) Analysis of individual mitochondriotropic moieties. TMRM-loaded HeLa cell mitochondria were incubated with 1.5 μM 17-AAG plus tetraguanidinium (TG-OH) or Gamitrinib-G4 (left panel) or 0.7 μM GA plus TPP-OH or Gamitrinib–TPP-OH (right panel) and analyzed for changes in fluorescence emission in the presence or absence of CsA (5 μM). Arrows indicate point of addition. (C) Cytochrome c (Cyto c) release. Mitochondria isolated from HeLa cells treated with Gamitrinibs or 17-AAG (20 minutes) were analyzed for cytochrome c release in supernatants (S) or pellets (P). Cox-IV or Ran was used as a mitochondrial or cytosolic marker, respectively. Reactivity of the antibody to Ran with isolated cytosolic extracts (C) was used as a control. (D) Mitochondrial accumulation. Isolated HeLa cell mitochondria were incubated with vehicle or Gamitrinib-G4 in the presence or absence of CsA and analyzed using absorbance. Data are the mean ± SEM. (E) Analysis of nontargeted Hsp90 inhibitors. Isolated HeLa cell mitochondria were incubated with increasing concentrations of the various indicated agents for 3 hours and analyzed for cytochrome c release. Data are representative of 2 independent experiments.

