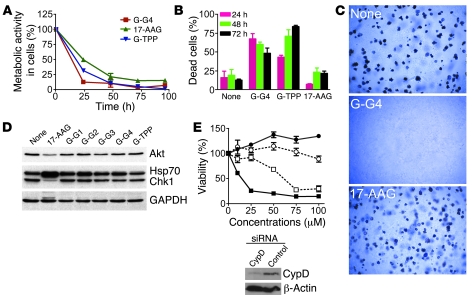
Figure 5. Gamitrinibs induction of mitochondrial apoptosis.
(A) Comparison with 17-AAG. SKBr3 cells were treated with Gamitrinibs or 17-AAG (10 μM) for the indicated time intervals and analyzed using MTT assay. Data are representative of at least 2 independent experiments. (B) Tumor cell killing. SKBr3 cells treated with vehicle, Gamitrinib-G4, Gamitrinib–TPP-OH, or 17-AAG (10 μM), for the indicated time intervals, were analyzed by Trypan blue exclusion. Data are the mean ± SEM (n = 3). (C) Colony formation. H460 cells treated with vehicle, 17-AAG (50 μM), or Gamitrinib-G4 (50 μM) for 4 hours were analyzed for colony formation in soft agar after 2 weeks. Representative microscopy fields are shown. Original magnification, ×40. (D) Client protein modulation. HeLa cells treated with the indicated Gamitrinibs, 17-AAG (5 μM), or vehicle were analyzed for modulation of Hsp90 client proteins Akt and Chk1 in the cytosol or changes in expression of Hsp70 after 24 hours by Western blotting. (E) Requirement for CypD in Gamitrinib anticancer activity. H460 cells transfected with control (closed symbols) or CypD (open symbols) siRNA were treated with 17-AAG (circles) or Gamitrinib-G4 (squares) and analyzed using MTT assay after 6 hours. Data are the mean ± SEM (n = 3). The inset shows Western blotting of CypD knockdown by siRNA.

