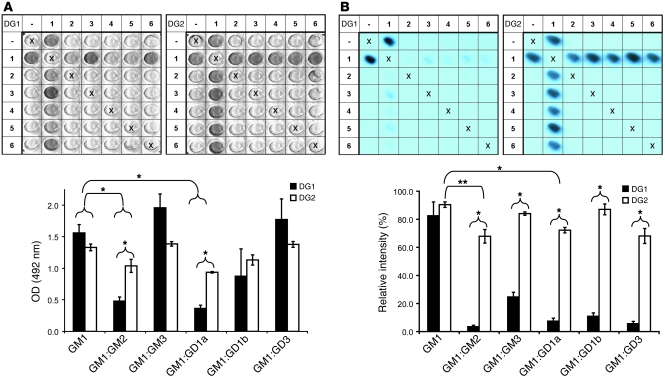
Figure 3. Reactivity of anti-GM1 mAbs DG1 and DG2 to ganglioside complexes containing GM1 in solid phase.
The ganglioside complex at each location is established by combining the row and column labels. Thus, coordinates 1,4 and 4,1 represent GM1:GD1a complex. Wells labeled X are negative controls (methanol only). (A) ELISA. DG1 (left) and DG2 (right) both bind GM1 alone, with no difference in average OD. The binding of both antibodies to complexes of GM1 and GM2 or GD1a is reduced as compared with GM1 alone. No difference was observed with other combinations investigated (GM1:GM3, GM1:GD1b, and GM1:GD3). DG1 binding to complexes GM1:GM2 and GM1:GD1a was less than that of DG2. Mean results ± SEM from 3 experiments are shown. (B) PVDF glycoarrays. DG1 was the primary antibody on the left membrane, DG2 on the right. Mean results ± SEM for 3 experiments are shown. No significant difference in GM1 binding was observed for the 2 antibodies. DG1 binding to GM1 complexes was significantly reduced compared with GM1 alone (P < 0.05, significance level for these comparisons not indicated in graph). DG2 binding GM1 complexes was marginally different compared with GM1 alone but significant for GM1:GM2 and GM1:GD1a. The inhibitory effect of complexes on antibody binding is greater for DG1 than for DG2. The average absolute reduction in signal intensity for GM1:GD1a complex, compared with GM1 alone, is 75.1% for DG1 and 18.2% for DG2 (P < 0.05). Error bars indicate SEM. 1, GM1; 2, GM2; 3, GM3; 4, GD1a; 5, GD1b; 6, GD3. *P < 0.05, **P < 0.01.

