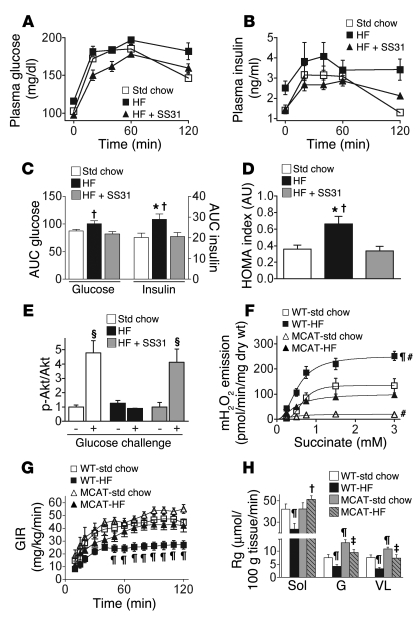
Figure 4. Mitochondrial-targeted scavenging of H2O2 prevents high-fat diet–induced insulin resistance in skeletal muscle.
(A–D) Whole body insulin sensitivity is preserved in high-fat diet–fed rats treated with SS31. (A) Plasma glucose and (B) plasma insulin concentrations in response to oral glucose challenge. (C) AUC (arbitrary units) for both glucose and insulin and (D) HOMA, a fasting index of insulin action. Data represent mean ± SEM; n = 9–10; *P < 0.05 vs. Std chow; †P < 0.05 vs. SS31-treated. (E) Preserved insulin signaling in high-fat diet–fed animals treated with SS31. Phosphorylated Akt relative to total Akt in response to glucose challenge in red gastrocnemius muscle (representative blots shown in Supplemental Figure 2). Data represent mean ± SEM; n = 4–5; §P < 0.05 vs. before glucose challenge. (F–H) Targeted expression of MCAT prevents high-fat diet–induced increase in mitochondrial H2O2 emission and insulin resistance in transgenic mice. (F) Succinate stimulated H2O2 emission (as described in Figure 1) during state 4 respiration (10 μg/ml oligomycin) in permeabilized red gastrocnemius fibers prepared from wild-type and MCAT mice (4- to 5-hour fasted) fed standard chow or high-fat (60%) diet for 12 weeks. (G) Glucose infusion rate (GIR) during hyperinsulinemic-euglycemic clamps. (H) Rate of glucose uptake (Rg) in soleus (Sol), gastrocnemius (G), and vastus lateralis (VL) skeletal muscle from mice in G. Data represent mean ± SEM; n = 4 for mH2O2 and n = 9–11 for glucose-clamp experiments; ¶P< 0.05 vs. WT–std chow; #P < 0.05 vs. MCAT-HF; ‡P < 0.05 vs. WT-HF and MCAT–std chow.

