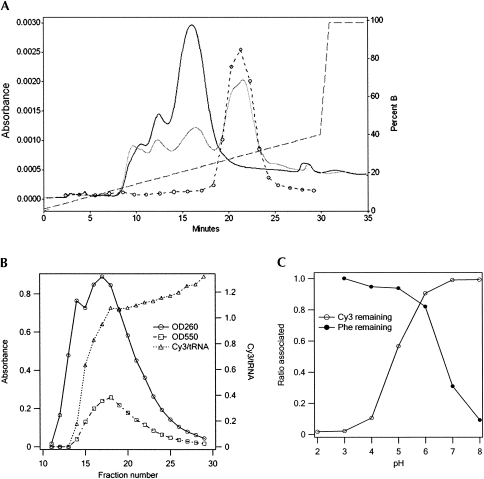
FIGURE 4.
Chromatographic purifications of tRNAPhes. (A) Phenyl-RP-HPLC resolution of Phe-tRNAPhe(red) from tRNAPhe(red). Gray and black solid lines are chromatographs of unpurified [3H]-Phe-tRNAPhe and tRNAPhe samples, respectively. Dashed line with circles shows [3H] counts of [3H]-Phe-tRNAPhe fractions. Dashed line alone shows the gradient. (B) Purification of Phe-tRNAPhe(Cy3) on an FPLC MonoQ column following labeling of Phe-tRNAPhe(red), fractions 18–26 in A with Cy3-hydrazide. The rise in Cy3/tRNA ratio in the later fractions is due to small amounts of doubly labeled tRNA. (C) Retention of [3H]-Phe and Cy3 with tRNAPhe following incubation of [3H]-Phe-tRNAPhe(Cy3) at 37°C for 2 h at various pH values. Cy3 content and [3H]-Phe content were determined following ethanol precipitation and TCA precipitation, respectively. Buffers were the same as in Figure 2B.

