FIGURE 7.
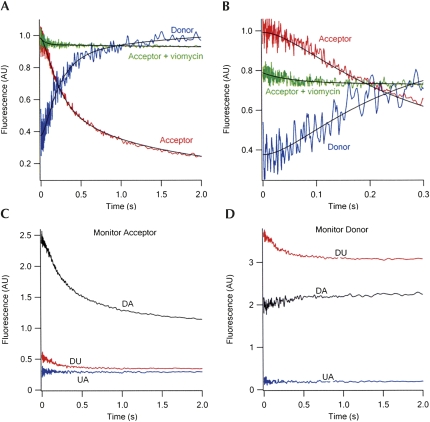
Time courses of FRET change during translocation. (A) PRE complex (0.1 μM, after mixing) containing fMetPhe-tRNAPhe(Cy3) in the A-site and tRNAfMet(Cy5) in the P-site (DA sample) was rapidly mixed with EF-G•GTP (2 μM, after mixing) in buffer A at 25°C, with excitation at 518 nm. Parallel experiments were carried out with the DU [Phe-tRNAPhe(Cy3)+fMet-tRNAfMet] and UA [Phe-tRNAPhe+fMet-tRNAfMet(Cy5)] samples. The red and blue traces are for fluorescence intensities monitored at acceptor wavelength (680 ± 10 nm) and donor wavelength (570 ± 10 nm), respectively. The traces shown are corrected for contributions to fluorescence change from the donor alone and acceptor alone traces at both 680 nm (C) and 570 nm (D). For acceptor, the corrected trace is equal to DA−(DU+UA). For donor, the corrected trace is equal to (DA−UA)/DU. Both traces were globally fit to a three-step model, I → II → III → IV, in which the acceptor fluorescence intensity of I and of II are essentially equal, and the large decrease in FRET signal is associated with II to III conversion. The green trace measures the acceptor fluorescence intensity when PRE complex was preincubated with viomycin (100 μM) for 1 min at 37°C before mixing with EF-G•GTP. (B) Same as (A), with expanded time scale. The green trace in the presence of viomycin has been offset for clarity. (C) Fluorescence change during translocation monitoring acceptor at 680 ± 10 nm. (D) Fluorescence change during translocation monitoring donor at 570 ± 10 nm.

