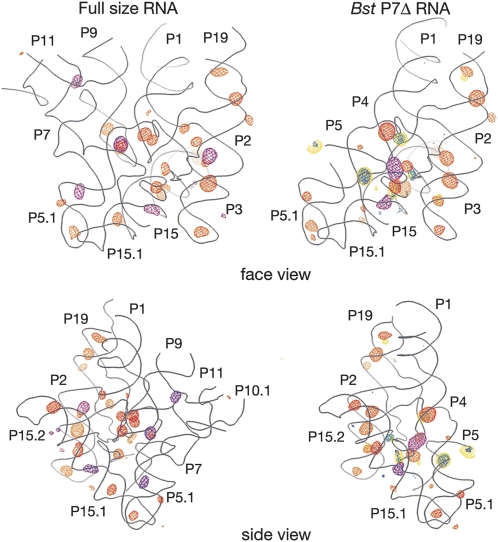
FIGURE 3.
Overall distribution of the anomalous scattering. Backbone traces for the models of the full-size RNA and the Bst P7Δ construct are shown as gray wire; two orientations for each construct are shown. (Orange mesh) Anomalous scattering by Os(III) hexamine, (purple mesh) scattering by Pb2+, (yellow mesh) scattering by Sm3+, (blue mesh) scattering by Gd3+, (green mesh) scattering by Yb3+. The RNA-phased anomalous scattering difference maps are contoured at 4.5σ for both derivatives of the full-size RNA and at 4σ for the derivatives of Bst P7Δ, except for the Pb2+-derivative of the Bst P7Δ RNA that is contoured at 5σ.

