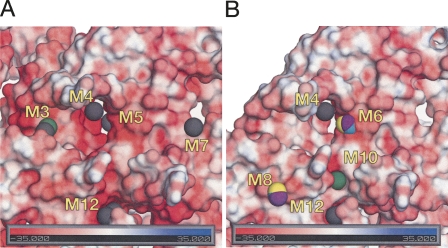
FIGURE 5.
Cation binding follows the distribution of electrostatic potential on the molecular surface of RNase P RNA. (A) Cation binding to the catalytic core of the full-size RNase P RNA (substrate-binding face). (Gray) Os(III) hexamine peaks, (green) Pb2+ peak. (B) Cation binding to the core of Bst P7Δ RNA. Same orientation as above. (Teal) Sm3+ peaks, (purple) Gd3+ peaks, (yellow) Yb3+ peaks.

