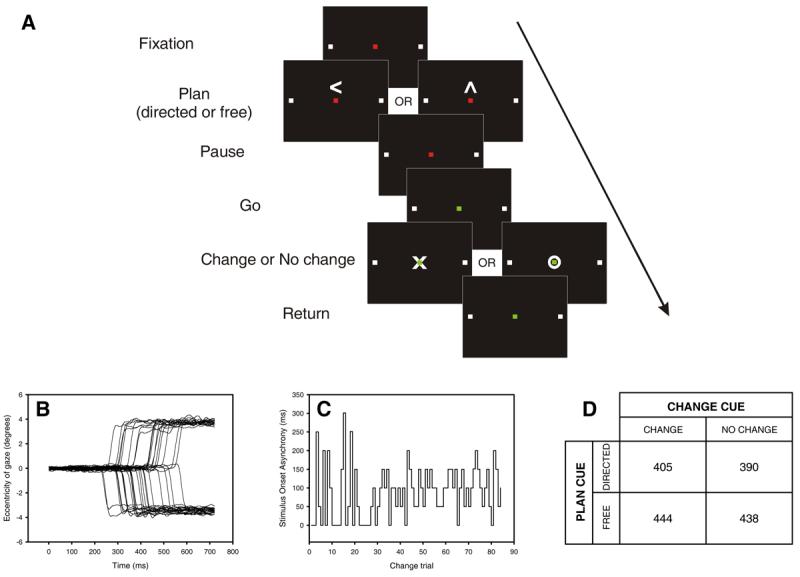
Figure 1.

A. Temporal sequence of visual cues during each trial (not to scale). While fixating a red square, subjects planned a speeded saccade to one of two targets (white squares) that were either freely chosen (free plan) or specifically indicated (directed plan; here a left plan is illustrated). A change in the fixation cue from red to green (‘go’ cue) signalled the execution of the saccade. A variable interval (SOA) after the ‘go’ cue, and before the saccade was executed, a ‘change’ or ‘no change’ cue instructed subjects either to continue with their plan or to execute a saccade to the opposite target instead. The SOA was modulated on-line to target a 50% success rate in directed change trials. B. Raw saccadic traces from one subject performing the task in the scanner (negative eccentricity indicates leftward displacement). Data from left directed change trials is shown. C. Plot of stimulus onset asynchrony (SOA) for directed change trials performed by one subject. After each direct change trial the SOA was automatically increased or decreased by 50 ms depending on whether the subject succeeded or failed in changing plan[40]. The algorithm sampled randomly from two independent threads starting at 0 and 300 ms. D. Group mean of individual subject median saccadic latencies (ms) for each trial type collected during scanning. At the group level, there was no significant main effect of choice (p = 0.09) or conflict (p = 0.57) on Friedman's test.
