
Figure 3.
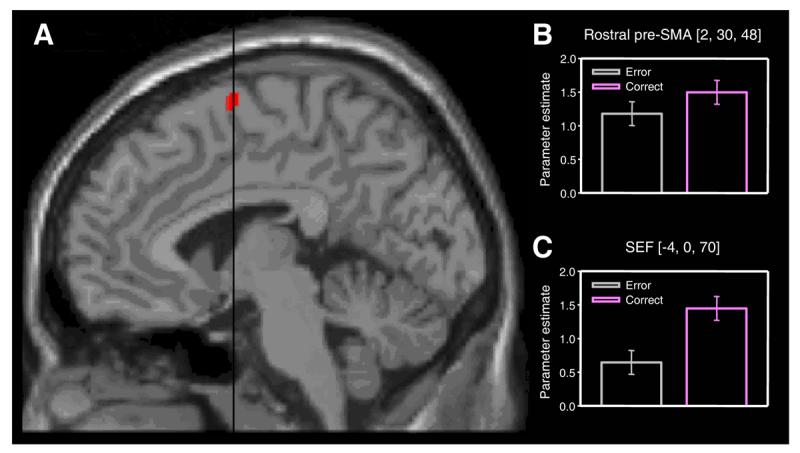
SEF activation associated with successfully changing plans. A. Comparison of successfully changed versus unsuccessfully changed directed trials reveals activity in the SEF. The statistical parametric map has been thresholded at p < 0.001 uncorrected, and superimposed on a MNI standard single subject T1-weighted MRI scan. Black line indicates position of the anterior commissure (VCA line). B. Signal change in the conflict-responsive rostral pre-SMA cluster (see Fig. 2) indexed by the parameter estimates for unsuccessfully (yellow) and successfully (blue) changed directed trials. Note absence of a significant difference (at p < 0.001 uncorrected). Error bars correspond to 90% confidence intervals. C. Corresponding plot for the SEF cluster showing that activity in this region discriminates between success and failure in changing oculomotor plan.