
Figure 2. H3K36me3 is enriched across C. elegans exonic chromatin.
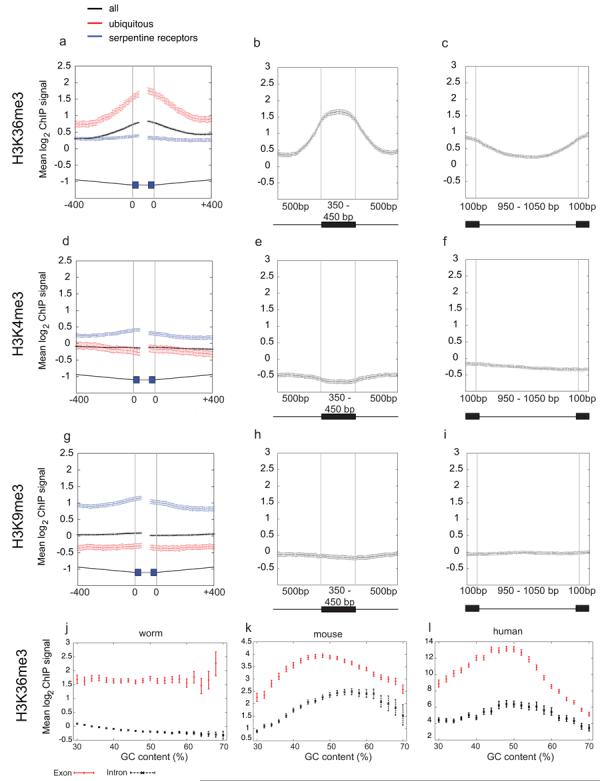
Mean log2 ChIP signals for (a-c) H3K36me3 (d-f) H3K4me3 and (g-i) H3K9me3. (a, d, g) plot signals across intron/exon and exon/intron boundaries where introns are at least 400bp and exons at least 80bp, excluding first and last exons. Black, exons of all genes; red, ubiq genes; blue, serp genes. In the gene model, thin grey lines represent 400bp of intron sequence, black boxes 40bp of exon sequence, and thick grey lines the centres of exons that vary in length. (b, e, h) mean log2 ChIP signals across exons of length 350-450bp flanked on both sides by introns of >=500bp. (c, f, i) mean log2 ChIP signals across introns of length 950-1050bp. In diagrams below plots, black boxes represent exons and black lines introns. Exon enrichment of H3K36me3 relative to a neighboring intron was confirmed by qPCR of non-amplified ChIP material in 8/8 cases tested (not shown). (j,k,l) H3K36me3 signals for exons and introns according to GC content. In C. elegans (j), mouse (k), and human (l), exon signals are higher than those of introns at every % GC implicating that enrichment of H3K36me3 on exons is not due to GC bias.