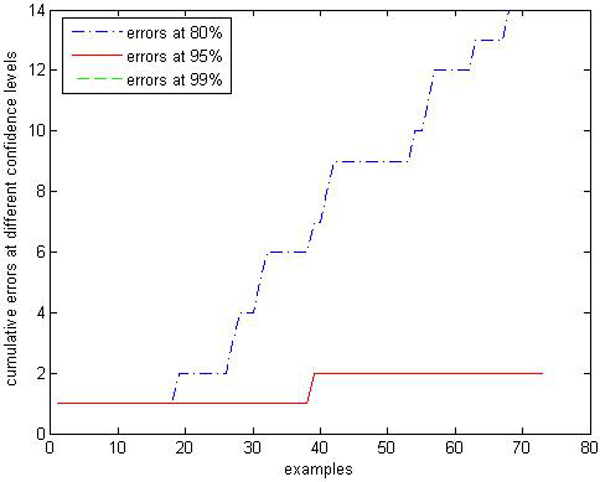
Figure 9.

Calibration Performance of CP-RF within class "primary hyperthyroid" on thyroid. In this experiment, we apply CP-RF and label conditional CP-RF in an online learning fashion. The X axis represents the number of test samples within class "primary hyperthyroid", and Y axis represents the number of error predictions at 3 confidence levels (80%, 95%, and 99%).
