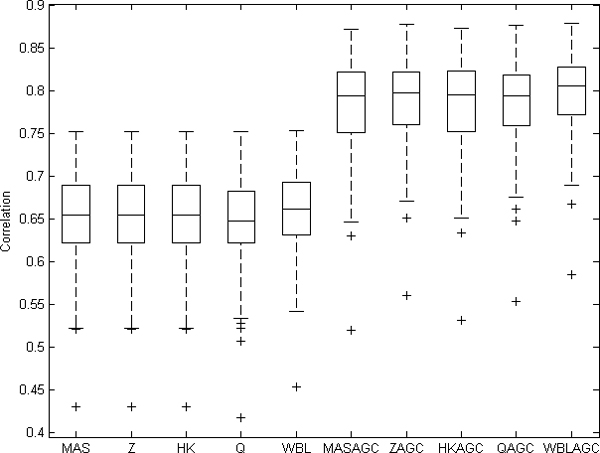
Figure 1.

Correlations between technical replicates. Values from 132 technically replicated samples are normalized with different normalization methods and correlations are computed based on logarithmic values. Overall, the AGC improved the correlations.
