
Figure 2.
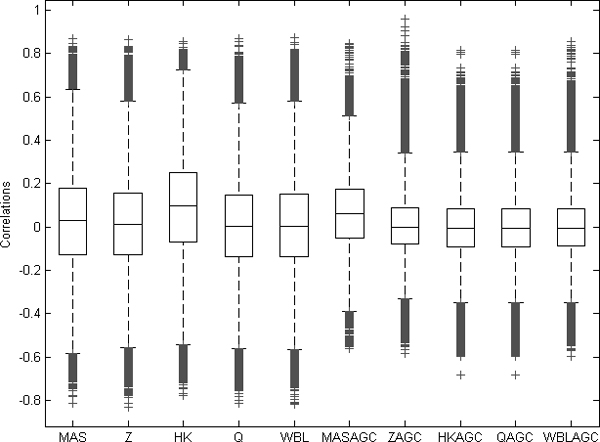
Correlation values between randomly selected gene pairs. The correlations were calculated between 500 randomly selected genes through 6,926 samples. The four AGC-normalized datasets ZAGC, HKAGC, QAGC, and WBLAGC have mean values closer to zero than the others (ANOVA with multiple testing procedure, α < 0.01).