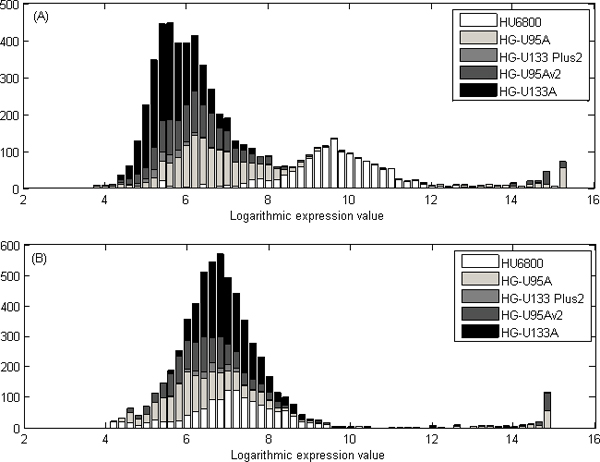
Figure 6.

Illustration of the effect of AGC normalization for a prostate specific gene KLK3. (A) The logarithmic expression values of the KLK3 gene before the AGC normalization are distributed based on the array generation. (B) The values are normalized with the AGC method, and there is no significant difference between the values from different array generations. The figure illustrates prostate specific gene, KLK3, and gene values in prostate samples have great values both before and after normalization. After AGC-normalization, the large values not caused by anatomy but array generation HU6800 are diminished.
