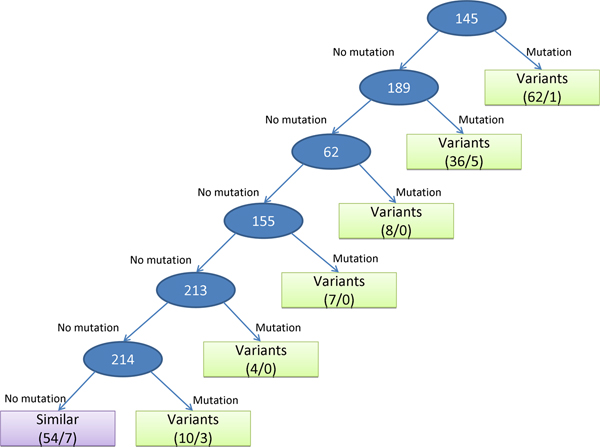
Figure 4.
The decision tree and rules for predicting antigenic variants. Each internal node (circle) is represented as an amino acid position. The leaf node (square) includes the predicted antigenic type (i.e. "antigenic variants" and "similar viruses"), the numbers of total pairs (the first value) and predicted error pairs (the second value) by applying this rule in this node.

