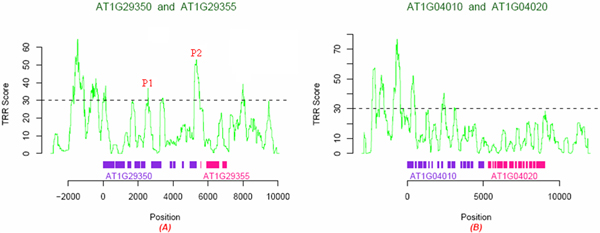
Figure 4.
TRR scores of genomic sequences. The violet region represents a gene and the pink region represents another. Colored bars mean exons of gene, blank areas between the same colored bars are introns, and the only one blank region between the different colored bars in each figure is the generally defined bidirectional promoter. (A) There is only one peak P2 located in intergenic region, suggesting this region is a transcriptional regulatory region (TRR). There is also one peak P1 in this figure, but it is not located in intergenic region. (B) No peak in intergenic region, suggesting no TRR here.

