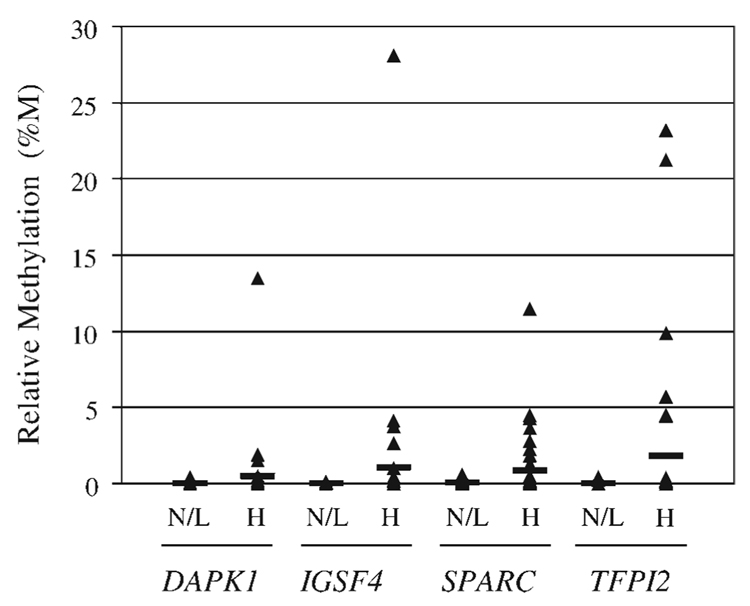
FIGURE 1.
Distribution of gene methylation in combined negative for intraepithelial lesion or malignancy (NILM)/low-grade squamous intraepithelial lesions (LSIL) and high-grade SIL (HSIL) Pap test samples. The relative level of methylation (percentage of methylation, %M) for each of the 4 genes (DAPK1, IGSF4, SPARC, and TFPI2) is shown for combined NILM/LSIL (N/L; n = 60) and HSIL (H; n = 39) samples. The black bar indicates the mean %M.

