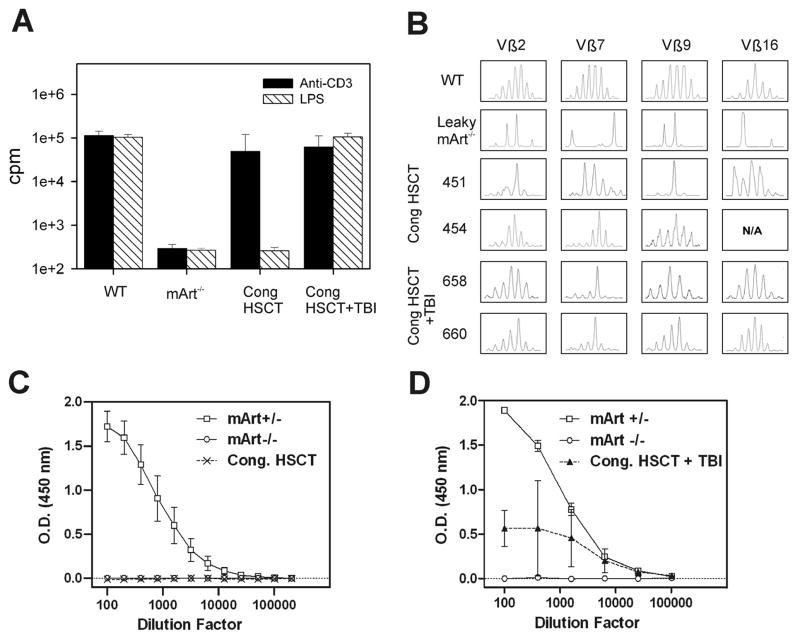
Figure 5. T and B cell proliferative responses, T cell receptor diversity, and specific IgM response post transplantation.
(A) Proliferative responses of lymphocytes to anti-CD3 antibody and LPS. B6 wild type mice (positive controls) and mArt-/- mice (negative controls) were compared to recipients of congenic HSCT with and without TBI at ≥3 months post transplant. Results (stimulated minus resting) are expressed as counts per minute (cpm) on a log scale. (B) TCR Vβ repertoire analysis. T cells were enriched from either thymus or spleen and prepared as in Materials and Methods. Four representative Vβ regions are shown from a representative B6 WT mouse, a leaky 129/SvJ mArt-/- mouse, two mArt-/- recipients of congenic HSCT (451 and 454), and two mArt-/- recipients of congenic HSCT with TBI (658, 660). (C) Serum IgM-specific antibody response to NP-Ficoll after immunization (minus pre-immune response). The figure shows the average response from recipients (n=4) of congenic HSCT at ≥3 months post transplant. B6 mArt+/- (n=7) and B6 mArt-/- (n=4) mice were used as positive and negative controls, respectively. (D) Serum IgM-specific antibody response to NP-KLH after immunization (minus pre-immune response). Average response from recipients (n=3) of congenic HSCT with TBI (3Gy) are compared to B6 mArt+/- (n=3) and B6 mArt-/- (n=3) controls.

