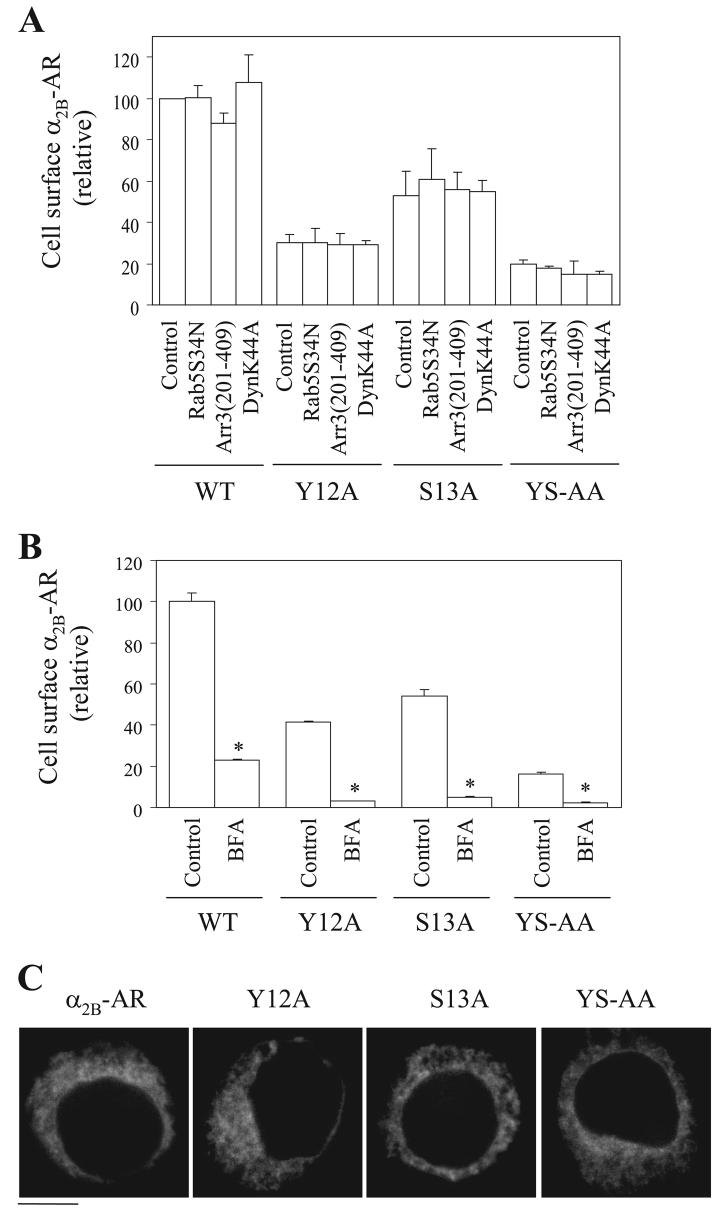
FIGURE 5. Effect of blocking endocytotic and anterograde transport on the transport of the Tyr-Ser motif mutants.
A, specific [3H]RX821002 binding to intact HEK293T cells co-transfected with α2B-AR and internalization blockers. HEK293T cells were transfected with α2B-AR, Y12A, S13A, or Y12A/S13A (YS-AA) together with pcDNA3 vector (control) or the dominant negative mutants Arr3-(201–409), DynK44A, or Rab5S34N. Receptor expression at the cell surface was measured by intact cell ligand binding as described in the legend of Fig. 1. The data shown are percentages of the mean value obtained from cells transfected with WT α2B-AR and pcDNA3 and are presented as the mean ± S.E. of three separate experiments. Receptor cell-surface expression has no significant differ-ence in cells transfected with Arr3-(201–409), DynK44A, or Rab5S34N as compared with their respective controls. B, specific [3H]RX821002 binding to intact HEK293T cells transfected with α2B-AR and treated with BFA. HEK293 cells were transfected with α2B-AR or its mutants and then incubated with ethanol (control) or BFA at a concentration of 5 μg/ml for 8 h. The data shown are percentages of the mean value obtained from cells transfected with WT α2B-AR and treated with ethanol and are presented as the mean ± S.E. of three separate experiments. *p< 0.05 versus respective control. C, effect of BFA treatment on the subcellular distribution of α2B-ARand its mutants. HEK293T cells were transfected with GFP-conjugated α2B-AR or its mutants, and subcellular distribution of the receptors was revealed by detecting GFP fluorescence as described under “Experimental Procedures.” The data are representative images of at least three independent experiments. Scale bar, 10 μm.

