Abstract
Monitoring the progression of osteoarthritis (OA) and the effects of therapy during clinical trials is still a challenge for present clinical imaging techniques since they present intrinsic limitations and can be sensitive only in case of advanced OA stages.
In very severe cases, partial or complete joint replacement surgery is the only solution for reducing pain and restoring the joint functions.
Poor imaging quality in practically all medical imaging technologies with respect to joint surfaces and to metal implant imaging calls for the development of new techniques that are sensitive to stages preceding the point of irreversible damage of the cartilage tissue.
In this scenario, X-ray phase contrast modalities could play an important role since they can provide improved contrast compared to conventional absorption radiography, with a similar or even reduced tissue radiation dose. In this study, the Analyzer-based imaging (ABI), a technique sensitive to the X-ray refraction and permitting a high scatter rejection, has been successfully applied in-vitro on excised human synovial joints and sheep implants.
Pathological and healthy joints as well as metal implants have been imaged in projection and computed tomography ABI mode at high resolution and clinically compatible doses (< 10 mGy). Volume rendering and segmentation permitted visualization of the cartilage from volumetric CT-scans.
Results demonstrate that ABI can provide an unequivocal non-invasive diagnosis of the state of disease of the joint and be considered a new tool in orthopaedic research.
Keywords: Osteoarthritis, metal implant healing, analyzer-based imaging, 3D rendering
Introduction
Osteoarthritis (OA) is a degenerative disorder characterized by loss of articular cartilage, thickening of the underlying subchondral bone, and osteophyte (bone excrescence) formation. OA is a poorly understood disease for which, presently, no cure exists. The principal treatment objectives are to control pain adequately, to improve function, and to reduce disability. In very severe cases, surgery remains the only remedy for reducing the pain and helping restore functions.
For all these reasons, understanding the causes of OA and finding better treatments are the major focuses of preclinical and clinical investigations.
In the light of what is currently presented in the literature and primarily discussed within the OA community during the “Bone and Joint Decade” of the World Health Organization [1], three major needs, and therefore tasks, exist for present and future research: 1) development of diagnostic markers and techniques for the very early stages of OA and for monitoring the OA progression; 2) development of methods and criteria for evaluating therapeutic response in the framework of cartilage-specific drugs innovation; 3) development of techniques for the evaluation of metal (and low X-ray contrast bioresorbable) implant healing.
Unfortunately, tools conventionally used to monitor the progression of OA remain unsatisfactory. For both OA assessment and drug intervention studies, the principal hallmarks are still the clinical observations of pain, inflammation, joint mobility, gait, and radiography. These diagnostic modalities can be sensitive only in cases of advanced stages of OA since they do not allow visualization or detection of very early degenerative alterations in joint tissue. Many other imaging techniques are used (i.e. computed tomography (CT), magnetic resonance imaging (MRI), ultrasound (UI), biomarker detection) but each of these presents its own intrinsic limitations.
Among all, the ‘gold standard’ for measuring cartilage thickness remains the indirect radiographic method, which allows the measurement of the narrowest joint-space width. Measurement of the joint-space width by standard radiography is used for both OA diagnosis and evaluation of drug effect even if it does not yield any information on the cartilage itself and provides only one measurement point. There are two major directions of radiological analysis in which advancements in X-ray technology could be particularly beneficial for orthopaedics:
-imaging of soft tissue joint components, such as cartilage and ligaments, in order to gather information on the structure of normal cartilage and the ways in which this tissue changes after damage or in pathological conditions for the development of rational treatment strategies.
-imaging of metal implant healing in bones, even though radiography allows the evaluation of an implant as a whole, at least along one axis of sight.
Radiography of metal implants is finally hampered by low local resolution caused by beam hardening based on the incident polychromatic light, thus, resulting in uncorrectable image errors.
Poor imaging quality in practically all medical imaging technologies with respect to articular cartilage calls for the discovery and development of new techniques that are sensitive to stages preceding the point of irreversible damage of the cartilage tissue [2].
In this scenario, phase contrast modalities have already been demonstrated to possess higher sensitivity with respect to conventional techniques without an increase of the delivered radiation dose [2–4].
The most advanced phase-contrast imaging methods utilize highly collimated and partially coherent synchrotron radiation (SR). For mammography applications, these methods are in an advanced preclinical phase and the first clinical trials are currently underway at the Elettra SR facility in Trieste, Italy [5]. Conventional X-ray sources may also be utilized [6, 7] but currently the most promising technology for transporting phase contrast imaging into a clinical environment is represented by the ‘table-top’ synchrotrons under development [8, 9].
Among the different modalities developed for exploiting phase contrast, the analyzer-based imaging (ABI) [10, 11], that utilizes contrast from refraction and scattering processes, has demonstrated great potential for medical applications regarding mammography, in particular, [12] and orthopaedics [2].
The ABI technique is based on the use of an analyzer crystal placed between the sample and the imaging detector. The perfect crystal analyzer acts as an angular filter that selectively accepts those X rays that have traversed the sample by satisfying the Bragg law for diffraction. Only this narrow range of X rays can reach the detector and contribute to the generation of an image [13]. The filter function is given by the rocking curve (RC) of the analyzer crystal and typically features an acceptance window (full width at half maximum (FWHM) of the RC) of a few microradians.
In earlier studies by the present authors, ABI showed the ability for the non-invasive detection of cartilage abnormalities, especially in the initial stages of degenerative joint disease (OA) or early in its progression, and also for the evaluation of the status of ingrowth of bone tissue into the implant surface [2, 14, 15].
These previous publications mainly focused on the application of ABI in the planar projection mode on excised human femoral heads and on metal implants in animals. Results presented in this paper, however, demonstrate the great potential of this phase contrast technique when the tomography modality is used on the same types of samples.
Starting from tomographic ABI slices, three dimensional rendering of articulations can be realized; examples both for cartilage and metal implants are here reported.
Materials and Methods
Samples
In-vitro experiments aimed at detection of articular cartilage degeneration and evaluation of implant integration were performed on excised human synovial joints and on metal implants in sheep bones, respectively.
Samples from patients were acquired in the course of surgical procedures such as joint replacement surgery and amputations, with patient consent and institutional approval, and from organ donors (through the auspices of the Gift of Hope Organ and Tissue Donor Network and with Rush University Medical Center IRB approval). The specimens were immediately fixed in 4% paraformaldehyde solution and stored in 1% paraformaldehyde prior use. Images were taken with the specimens in either air or water. The human specimens investigated in this work are a human ankle joint and a human interphalangeal joint of the big toe.
The metal implants were sand blasted Ti6Al4V alloy, coated with a 55 μm-thick layer of hydroxyapatite (HA) with an average grain size of 5 μm. Implants consisted of a cylinder of 10 mm diameter and 15 mm height containing different profiles to test for the response of bone to various geometries. In particular, the surface contained a ring-shaped groove of 4 mm width × 1 mm depth and three longitudinal indentations 3 mm wide (round) × 1 mm deep (rectangular) in cross section. The longitudinal axis contained a threaded hole closed during implantation by two screws. The thread serves as an anchorage for a pull-out device (for further details see Ref. [15]). This specific type of model implants has been used for insertion into the tibial head of sheep. After implantation, animals were maintained for up to 20 weeks prior to sacrifice. Bones containing the implants were cut into segments, preserved with paraformaldehyde, and subsequently examined by ABI.
Analyzer-based imaging: experimental set-up and parameters
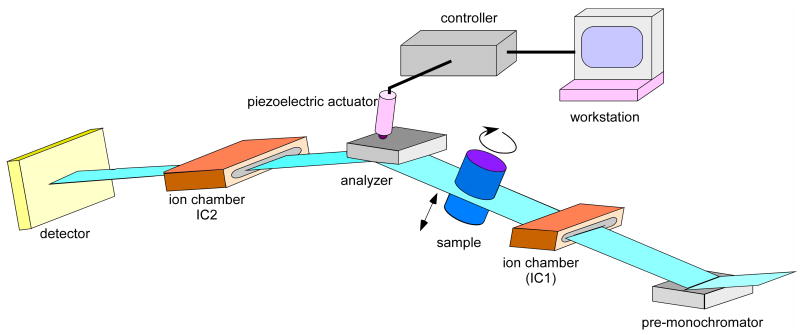
All experiments were performed at the ID17 Biomedical Beamline of the ESRF (Grenoble, France). The storage ring is a 6 GeV machine and the X-ray source is a 21 pole wiggler. A detailed description of the ABI experimental set-up may be found in earlier publications [11, 16]. Fig. 1 shows a scheme of the set-up used at the beamline ID17. Briefly, by means of a silicon crystal system a monochromatic highly collimated X-ray beam is extracted from the white X-ray beam spectrum issued from the synchrotron radiation source. The monochromatic beam passes through the sample and the emerging refracted and scattered X-rays are then analyzed by means of another perfect crystal, identical to the first one. By tuning the analyzer, it is possible to select different angles of deflection along the crystal RC and therefore vary the image contrast of the structures depending on their refractive properties. At the peak position (TOP), the reflecting planes of the analyzer crystal are parallel to the monochromator planes and the radiation that passes the analyzer is identical to the beam which passes through the sample without interaction. In this way, almost scatter-free absorption images can be recorded, having much higher quality than conventional absorption based images [7, 17, 18]. When setting the analyzer on an angular position on the slope of the RC, intensity modulation can be produced by X-ray deflection within the crystal lattice due to refraction. The directional properties of the passing beam are opposite at the low-angle (MINUS) side and the high-angle (PLUS) side of the RC.
Fig. 1.
Scheme of the analyzer-based imaging experimental set-up.
Images presented in this work were acquired at different angular positions along the analyzer RC in order to define the optimum conditions for imaging the specific sample under investigation.
Given the laminar shape of the synchrotron beam and the fact that it is stationary, images are obtained by scanning the sample through the X-ray beam. Energies used are 33 keV and 51.5 keV. The monochromator and analyzer crystal reflection is set to the (333) reflection for all acquisitions. At these energies, the theoretical FWHM of the crystals RC is 2.4 and 1.45 μrad, respectively.
The imaging detector used is the Fast Readout Low Noise (FReLoN) CCD camera coupled to a fiberoptical taper developed at the ESRF. The FReLoN taper optics shows an active input surface of 94 × 94 mm2 where X-rays are converted to visible light by a fluorescent screen; this secondary radiation is then guided by a fiberoptic taper with a 3.2:1 reduction ratio and extra-mural absorption (Schott) onto the 2048 × 2048 pixel2 14 × 14 μm2 CCD (Atmel Corp, USA). This reduction allows an effective pixel size of about 46 × 46 μm2 to be achieved. The powder phosphor screen (Gd2O2S:Tb, 5 g/cm3 density) can be easily exchanged in order to optimize the X-ray conversion with the different experimental applications and the selected energy. At the energies considered in this study, a 100 μm thick screen was used giving the best absorption efficiency/spatial resolution ratio. In particular, the resolution is about 10 lp mm−1 at 5% level of the MTF (modulation transfer function). The DQE (detective quantum efficiency) at zero frequency is 0.3÷0.4 [19].
Image reconstruction
In CT imaging with SR, the sample rotates around an axis which is perpendicular to the incident laminar beam. After flat field normalization, images are reconstructed using the HST (High Speed Tomography) program, which utilizes a direct filtered backprojection algorithm [20].
Depending on the degree of contrast generated by the sample structures, the image segmentation was performed either manually, by delineating the cartilage interfaces, or by operating on the grey level histogram. The resulting volumes were then reconstructed in 3D using the software VGStudioMax 1.2 (Volume graphics, Heidelberg, Germany). Segmentation of the different bones was performed by region growing using the “3D magic wand tool” of VGStudio Max.
Results
As previously mentioned, the work presented here mainly focuses on the application of CT analyzer-based imaging (CT-ABI) for the study of articular cartilage and metal implants in sheep. Results on the different investigated samples are hereafter separately reported. The last paragraph will be entirely dedicated to the three-dimensional rendering of both articulations and implants.
Human ankle
Since the ankle is a weight-bearing joint that absorbs the body’s full impact, pain from an injured or diseased ankle is especially severe and debilitating. Because the ankle is so integral to an active lifestyle, it is an injury-prone part of the body for young and older people alike. Even moderate sprains and fractures can lead to problems, sometimes appearing years later.
When OA is advanced, ankle replacement with an artificial joint or ankle arthrodesis are terminal options. Arthrodesis is successful and durable but renders the joint permanently immobilized. Early detection of cartilage degeneration for the ankle joint is therefore a crucial issue in orthopaedics.
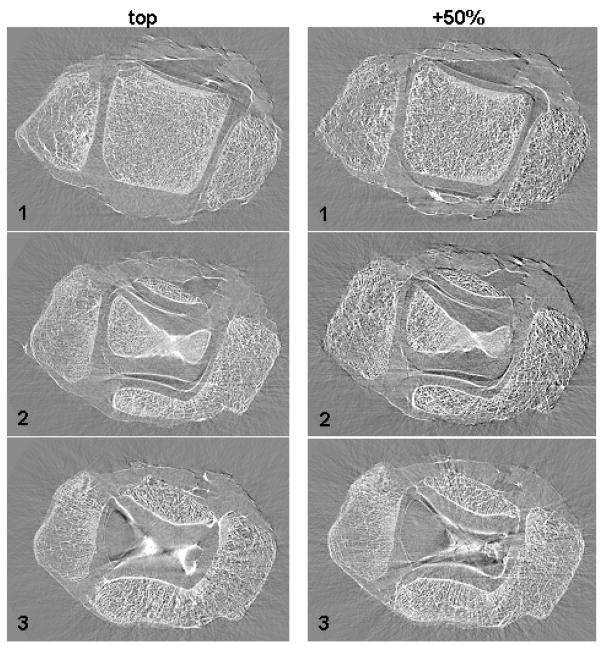
ABI tomography slices at three different heights inside an ankle joint are presented in Fig. 2. Images have been acquired with the Si (333) analyzer crystal set at the TOP (left column) and PLUS 50 % (right column) positions at an energy of 51.5 keV. In both slices “1” the three bones forming the articulation (tibia, fibula and talus) and the borders of the cartilage tissues covering the bones are visible. By moving up along the articulation, the talar bone (bone in the central part of the image) gradually disappears as we enter the joint space (slices “3”) taken up by the cartilage tissue covering the tibia and talus articular surfaces.
Fig. 2.
ABI tomographic images of the human ankle (experimental parameters: 51.5 keV and Si (333)) at the TOP (left column) and PLUS 50% (right column) positions along the analyzer crystal rocking curve (more details in the text)
After having compiled the acquired axial slices, suitable software (in this case ImageJ 1.33u1) can be used to virtually re-slice the volume and obtain frontal and sagittal slices of the sample.
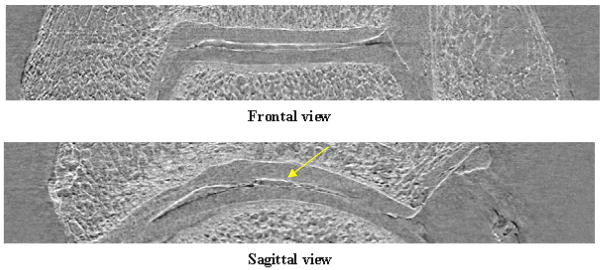
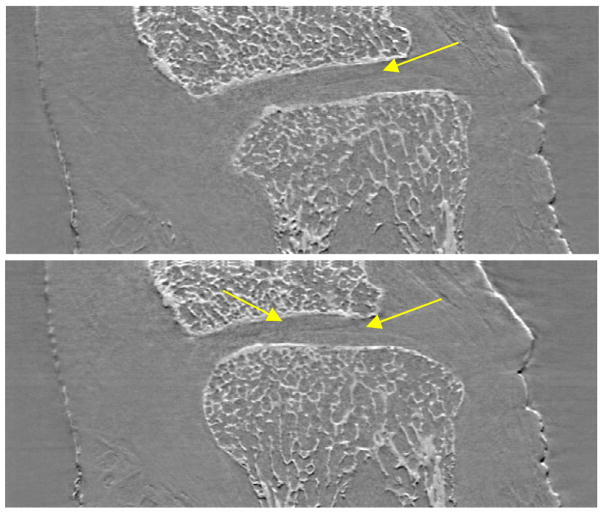
In Fig. 3 an example of frontal and sagittal slices of the ankle under investigation is shown. Thanks to the high edge-detection capability of the ABI technique, the lateral views of the sample allow to analyze the status and the thickness of the cartilage tissue as function of the depth inside the articulation in a much easier manner than through axial tomographs. This type of evaluation is not possible on simple projections since they are an integral of the signals produced along the X-ray path inside the object. The study of lateral sections of the examined ankle has revealed some irregularities (yellow arrow) in the cartilage tissue that must be histologically verified in order to establish if they are real damages or just image artefacts.
Fig. 3.
Lateral slices of the ankle constructed by ABI tomography acquisitions. The yellow arrow indicates structural irregularities within the cartilage tissue
Human big toe
In this study, the cartilage tissue between the proximal and the distal phalanges (interphalangeal joint) of a human big toe was examined. Cartilage tissue around the extremities of the two phalanges is very thin and is usually undetectable by conventional imaging techniques.
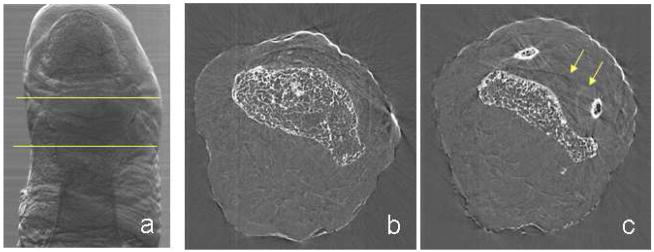
ABI planar projection images of the big toe have been collected but the cartilage was not resolved from the surrounding tissue signals. This fact is largely due to the particular saddle-shape morphology of the bones which, due to the orientation of the toe with respect to the beam, overlap with the soft tissue in between. An example of ABI projection image of the investigated sample is presented in Fig. 4a (PLUS 50 % slope image at 30 keV).
Fig. 4.
(a) ABI projection (PLUS 50%) of a human big toe: the area between the yellow lines indicate the part imaged by CT-ABI. (b, c) ABI tomographic slices of the human big toe: the yellow arrows indicate the border of the cartilage tissue surrounding the joint bones (experimental parameters: 30 keV and Si (333))
In order to overcome the intrinsic limitations due to the sample structure, ABI tomography at the joint site (region indicated by the two yellow lines in the ABI projection of Fig. 4a has been performed at an energy of 30 keV.
In Fig. 4b,c, a couple of CT-ABI slices of the big toe acquired with the analyzer at the TOP position are shown as representative examples. The image on the left is a slice inside the distal phalange, while the image on the right has been acquired in proximity of the joint space. In the latter, besides bone trabecles, some lines appear (indicated in the image by yellow arrows) and they precisely are the borders of the cartilage tissue surrounding the two phalanges. The elliptical lines around the two small areas of bone are the tips of the proximal phalange, while the darker line in the middle is due to the contact between cartilages of the two bones.
Frontal and sagittal slices, virtually obtained and presented in Fig. 5, allow the visualization of the cartilage covering the two phalanges of the big toe joint as well, proving the high potential of ABI tomography as compared to simple projection for this kind of investigation.
Fig. 5.
Lateral slices of the big toe constructed by ABI tomography acquisitions (experimental parameters: 30 keV and Si (333)). The yellow arrows indicate the edges of the cartilage tissue covering the two joint bones
Metal implants
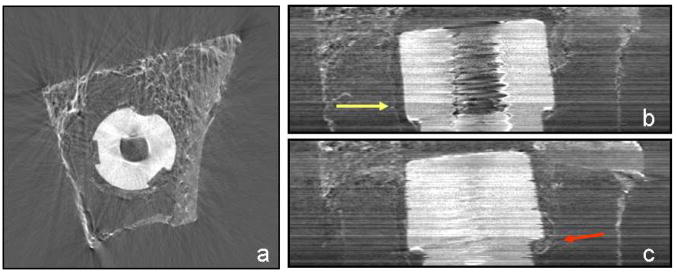
Pilot ABI tomography imaging of implants have also been performed. In Fig. 6a, a representative axial slice of a sheep implant (7 days post surgery) acquired at 51.5 keV with the analyzer crystal set at the TOP position is presented. The implant appears as a white perforated disk in the center of the bone in which it is embedded. The seemingly “empty” space within the specimen is occupied by fat tissue typical of the yellow bone marrow in old animals. The cortical bone (the tissue with the highest density) and the trabecular bone of the spongiosa are the bright elements of the specimen.
Fig. 6.
(a) ABI axial tomographic slice of a sheep metal implant acquired at 51.5 keV with the Si (333) analyzer crystal set at the TOP position (more details in the text body). (b, c) Lateral slices of the metal implant constructed by ABI tomography acquisitions. The yellow arrow indicates the interface between the bone tissue and a soft tissue formed between the bone and the implant; the red arrow indicates the beginning of the cortical bone formation at the groove of the implant
In Fig. 6b,c, an example of the virtual frontal and sagittal slices of the sheep implant is presented. These images are quite noisy since the energy used was not optimal for this type of sample (excess absorption due to low energy). However, some interesting details are visible. The yellow arrow indicates a line which is very probably the interface between the bone tissue and a soft tissue formed between the bone and the implant, possibly inflammatory granulation tissue, while the red arrow points out the beginning of cortical bone formation into the indentation of the implant.
Three-dimensional image rendering from CT-ABI
Starting from CT-ABI images, a three-dimensional reconstruction of the samples can obtained.
The specimens considered in this particular work are the big toe articulation and a sheep implant.
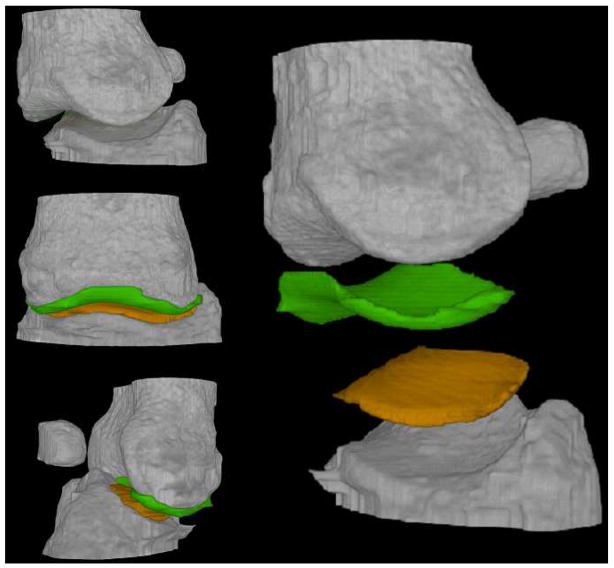
For the big toe joint, a slice by slice manual segmentation of the two cartilages of the toe articulation has been performed. The final rendering consisted of displaying all the segmented volumes (bones and cartilages) in a common three-dimensional virtual space with different colours. The result is shown in Fig. 7.
Fig. 7.
Three-dimensional rendering of the human big toe (experimental parameters: 30 keV and Si (333))
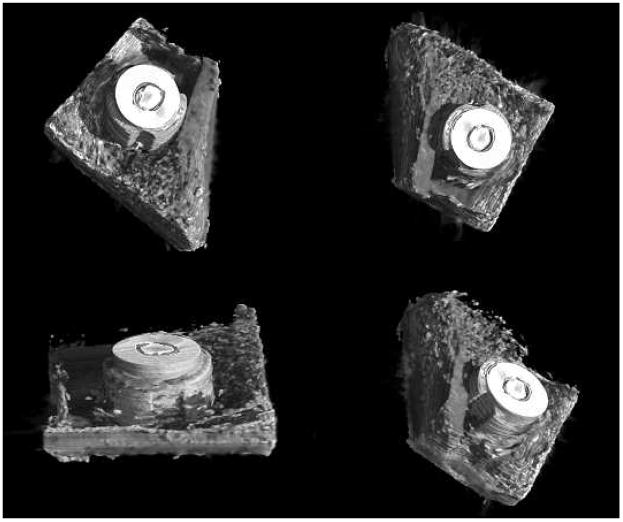
In Fig. 8 the three-dimensional rendering of a metal implant is presented. In the segmentation, thresholds have been chosen in such a way as to enhance the visualization of the metal implant and the cortical bone but to neglect soft tissue signals. In this figure, different views of the reconstructed volume are shown. The emerging part of the implant, in reality, is embedded in soft tissue within the shaft of the bone (e.g. fatty marrow), as demonstrated by the results previously presented on ABI projections and tomography. In the last image of Fig. 8, the hole in the cortical bone made during surgical implantation can be clearly discriminated.
Fig. 8.
Three-dimensional rendering of the sheep metal implant (experimental parameters: 51.5 keV and Si (333))
Discussion and conclusions
The feasibility and the potential of analyzer-based imaging (ABI) have already been demonstrated earlier by the authors and other teams, comparing ABI results with those produced by conventional radiology. These investigations demonstrate that ABI is able to provide high image contrast and resolution revealing the cartilage tissue architecture, with the least amount of false signals [12, 14]. ABI, in contrast to other techniques, is specifically sensitive to the refraction properties of the tissues and it is able to enhance material edges, generating images that most closely resemble the appearance of anatomical and histological tissue structures [21].
Even though the physical basis for the generation of the images differs drastically from the otherwise commonly used techniques, image interpretation may be in many cases facilitated for physicians since the human brain is used to resolve deflected light as spatial information. On the other hand, because of the richness of details visible in ABI projection images, the radiological interpretation is not always straightforward. For this reason, backing the two-dimensional ABI investigation with tomographic ABI acquisitions may represent a unique non-destructive diagnostic tool for the evaluation of cartilage status and metal implant healing.
In light of these considerations, the present set of data chiefly aims at demonstrating the high sensitivity of the ABI technique, when extended to the tomography modality, by presenting results of CT-ABI on human joints and metal implants in sheep bone.
Even within this narrow range of samples, ABI tomographs demonstrated visualization of inner structures that plain projections often “hide” because of the overlap of the signals produced along the X-rays by superimposed tissues. An analysis of the status and thickness of the articular cartilage and the bone growth into implants as a function of the depth inside the specimen is not only possible but also much more sensitive with respect to conventional radiography.
By manual segmentation, it was possible to separate cartilage from the entire structure of the articular joint allowing the evaluation of its functional status including its thickness (rather than only depicting the space between two adjacent bone surfaces). In the case of the metal implant, three-dimensional rendering is particularly interesting because it permitted visualization of bone ingrowth into the implant and discrimination between cortical bone and soft tissue. This may be useful, for instance, for future in-vivo longitudinal evaluation of the effectiveness of ingrowth factors in animal models, thus providing an opportunity to spare animals and save costs.
Results presented here demonstrate that the specificities of phase contrast techniques are able to fulfil many of the OA research requirements by improving the accuracy of the diagnosis and the sensitivity of disease progression monitoring.
Moreover, thanks to the highly sensitive edge-detection of the ABI technique, coupled with the volumetric analysis enabled by the tomographic modality, CT-ABI has the potential to become an important non-invasive alternative to histological examination in Orthopaedics.
Nevertheless, all results presented until now have been obtained on excised specimens from the human or animal body. It remains to be determined whether the technique can be extended to in-vivo study by using living animals. Pilot experiments, by the authors, have already been performed at the ESRF on guinea pigs because of their genetic propensity to develop arthritis. These preliminarily indicate the feasibility of in vivo studies with ABI-based imaging.
Acknowledgments
This work has been supported by various grants given to Juergen Mollenhauer and Andreas Wagner by the German Ministry for Education and Research, by grant RO1-AR48292 to Carol Muehleman from NIH-NIAMS.
The authors thank C. Nemoz, M. Renier, Dr. H. Requardt and T. Brochard for their invaluable support in this experimental work and Dr. P. Tafforeau for his contribution to the image post-processing.
Footnotes
ImageJ 1.33u, Wayne Rasband - National Institutes of Health, USA (http://rsb.info.nih.gov/ij)
Publisher's Disclaimer: This is a PDF file of an unedited manuscript that has been accepted for publication. As a service to our customers we are providing this early version of the manuscript. The manuscript will undergo copyediting, typesetting, and review of the resulting proof before it is published in its final citable form. Please note that during the production process errors may be discovered which could affect the content, and all legal disclaimers that apply to the journal pertain.
References
- 1.World Health Organization. Bone and Joint Decade. http://www.boneandjointdecade.org.
- 2.Mollenhauer J, Aurich ME, Zhong Z, et al. Diffraction-enhanced X-ray imaging of articular cartilage. Osteoarthritis and cartilage. 2002;10:163–171. doi: 10.1053/joca.2001.0496. [DOI] [PubMed] [Google Scholar]
- 3.Arfelli F, Bonvicini V, Bravin A, et al. Mammography with synchrotron radiation: phase-detection techniques. Radiology. 2000;215(1):286–293. doi: 10.1148/radiology.215.1.r00ap10286. [DOI] [PubMed] [Google Scholar]
- 4.Keyriläinen J, Fernández M, Fiedler S, et al. Visualisation of calcifications and thin collagen strands in human breast tumour specimens by the diffraction-enhanced imaging technique: a comparison with conventional mammography and histology. European Journal of Radiology. 2005;53:226–237. doi: 10.1016/j.ejrad.2004.03.015. [DOI] [PubMed] [Google Scholar]
- 5.Dreossi D, Bergamaschi A, Schmitt B, et al. Clinical mammography at the SYRMEP beam line: Toward the digital detection system. Nucl Instr Meth A. 2007;576:160–163. [Google Scholar]
- 6.Wilkins S, Gureyev T, Gao D, et al. Phase-contrast imaging using polychromatic hard X-rays. Nature. 1996;384:335–338. [Google Scholar]
- 7.Ingal V, Beliaevskaya E, Brianskaya A, et al. Phase mammography--a new technique for breast investigation. Phys Med Biol. 1998;43(9):2555–2567. doi: 10.1088/0031-9155/43/9/009. [DOI] [PubMed] [Google Scholar]
- 8.Hirai T, Yamada H, Sasaki M, et al. Refraction contrast 11×-magnified X-ray imaging of large objects by MIRRORCLE-type table-top synchrotron. J Synchrotron Radiat. 2006;13:397–402. doi: 10.1107/S0909049506027026. [DOI] [PubMed] [Google Scholar]
- 9.Lyncean Technologies. Lyncean Technologies I; Palo Alto, CA: 2006. Company Information—News & Events. http://www.lynceantech.com/company. [Google Scholar]
- 10.Davis T, Gureyev T, Gao D, et al. X-ray image contrast from a simple phase object. Phys Rev Lett. 1995;74(16):3173–3176. doi: 10.1103/PhysRevLett.74.3173. [DOI] [PubMed] [Google Scholar]
- 11.Bravin A. Exploiting the X-ray refraction contrast with an analyser: the state of the art. Journal of Physics D: Applied Physics. 2003;36:A24–A29. [Google Scholar]
- 12.Bravin A, Keyriläinen J, Fernandez M, et al. High-resolution CT by diffraction-enhanced x-ray imaging: mapping of breast tissue samples and comparison with their histo-pathology. Phys Med Biol. 2007;52:2197–2211. doi: 10.1088/0031-9155/52/8/011. [DOI] [PubMed] [Google Scholar]
- 13.Podurets K, Somenkov V, Shilstein S. Refraction-contrast radiography. Sov Phys - Tech Phys. 1989;34(6):654–657. [Google Scholar]
- 14.Wagner A, Aurich M, Sieber N, et al. Options and Limitations of Joint Cartilage Imaging: DEI in Comparison to MRI and Sonography. Nucl Instr Meth A. 2005;548:47–53. [Google Scholar]
- 15.Wagner A, Sachse A, Keller M, et al. Quality evaluation of Titanium Implant Ingrowth into Bone by Diffraction Enhanced Imaging (DEI) Phys Med Biol. 2006;51:1313–1324. doi: 10.1088/0031-9155/51/5/019. [DOI] [PubMed] [Google Scholar]
- 16.Fiedler S, Bravin A, Keyriläinen J, et al. Imaging lobular breast carcinoma: comparison of synchrotron radiation DEI-CT technique with clinical CT, mammography and histology. Phys Med Biol. 2004;49:175–188. doi: 10.1088/0031-9155/49/2/001. [DOI] [PubMed] [Google Scholar]
- 17.Pisano E, Johnston R, Chapman D, et al. Human breast cancer specimens: diffraction-enhanced imaging with histologic correlation--improved conspicuity of lesion detail compared with digital radiography. Radiology. 2000;214(3):895–901. doi: 10.1148/radiology.214.3.r00mr26895. [DOI] [PubMed] [Google Scholar]
- 18.Hasnah M, Oltulu O, Zhong Z, et al. Application of absorption and refraction matching techniques for diffraction enhanced imaging. Rev Sci Instr. 2002;73(3):1657–1659. [Google Scholar]
- 19.Coan P, Peterzol A, Fiedler S, et al. Evaluation of imaging performance of a taper optics CCD ‘FReLoN’ camera designed for medical imaging. J Synchrotron Radiat. 2006;13:260–270. doi: 10.1107/S0909049506008983. [DOI] [PubMed] [Google Scholar]
- 20.Dilmanian A, Zhong Z, Ren B, et al. Computed tomography of x-ray index of refraction using the diffraction enhanced imaging method. Phys Med Biol. 2000;45(4):933–946. doi: 10.1088/0031-9155/45/4/309. [DOI] [PubMed] [Google Scholar]
- 21.Majumdar S, Sema-Issever A, Burghardt A, et al. Diffraction enhanced imaging of articular cartilage and comparison with micro computed tomography of the underlying bone structure. European Radiology. 2004;14:1440–1448. doi: 10.1007/s00330-004-2355-8. [DOI] [PubMed] [Google Scholar]


