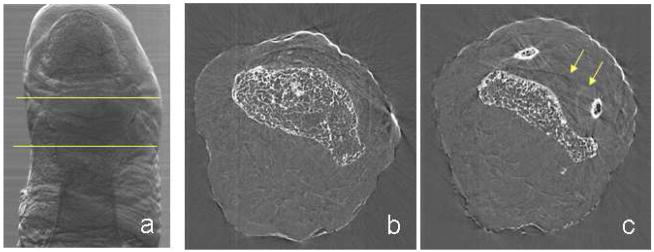
Fig. 4.
(a) ABI projection (PLUS 50%) of a human big toe: the area between the yellow lines indicate the part imaged by CT-ABI. (b, c) ABI tomographic slices of the human big toe: the yellow arrows indicate the border of the cartilage tissue surrounding the joint bones (experimental parameters: 30 keV and Si (333))

