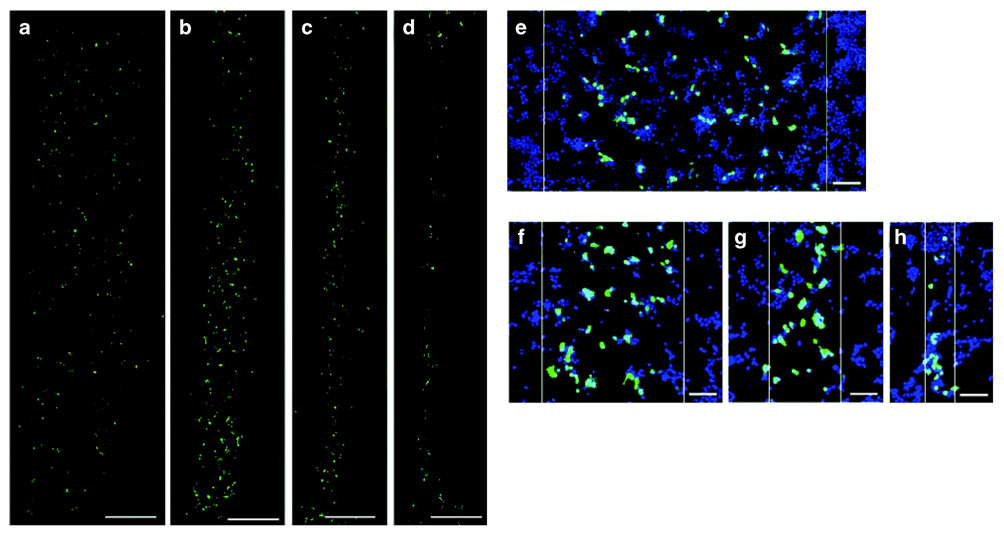
Figure 3. HEK293T cells expressing the reporter gene enhanced green fluorescent protein (EGFP) in a pattern.
EGFP expression (green) within cells cultured on substrates with patterned DNA complex deposition using Pluronic-treated microchannels: (a) 1,000 µm, (b) 500 µm, (c) 250 µm, and (d) 100 µm. Higher-magnification images present cell nuclei (blue) and transfected cells (green) overlaid: (e) 1,000 µm, (f) 500 µm, (g) 250 µm, and (h) 100 µm. White lines indicate pattern boundaries. Bars = 500 µm (a–d) and 100 µm (e–h).

