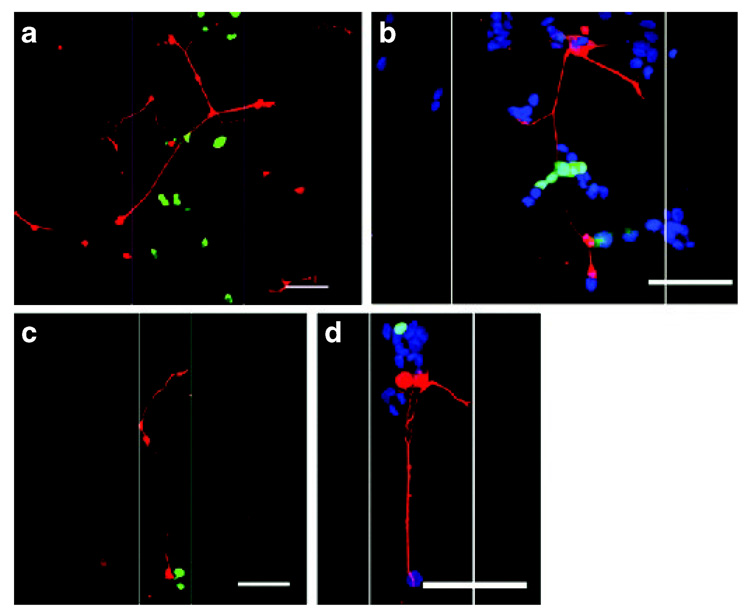
Figure 5. Neurons cultured with cells expressing nerve growth factor (NGF) in patterns.
Neurite extension (red) was observed at the region of transfected cells (green): (a, b) 250 µm width; (c, d) 100 µm width. pNGF to pEGFP ratio of 50:50. White lines indicate pattern boundaries. Cell nuclei (blue) are visible in (b, d). Bars = 100 µm.

