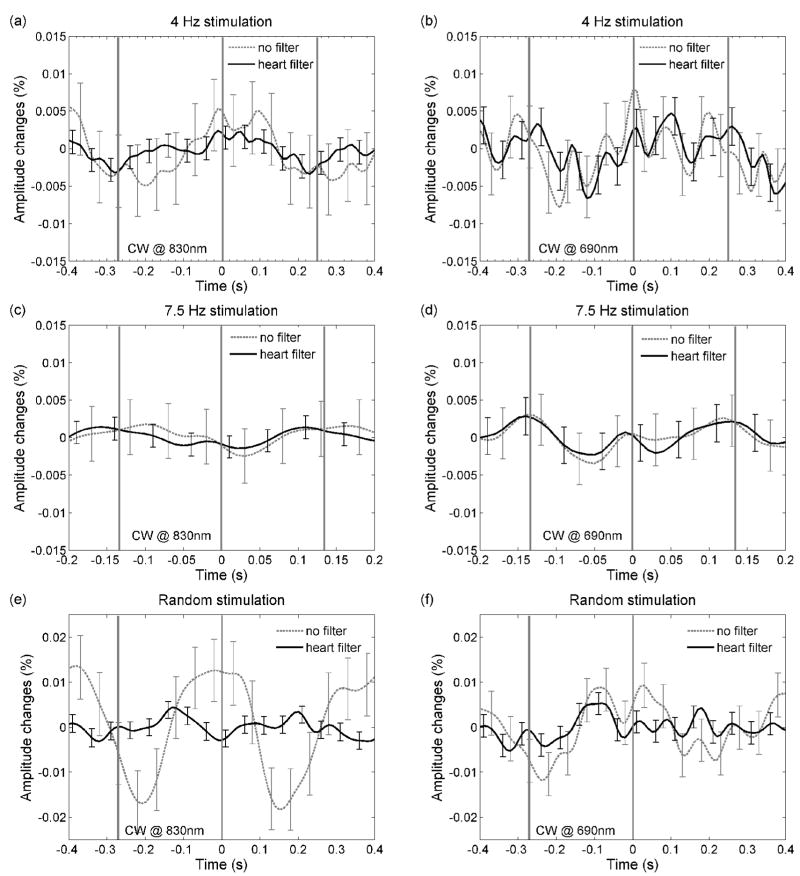
Figure 8.
Grand average of the fast amplitude responses for the CW measurements at 4Hz (panel a and b), at 7.5Hz (panel c and d), and for the random stimulation (panel e and f). The error bars are standard errors. The left panels show results at 830 nm, the right panels show results at 690 nm. In all graphs the results after applying the adaptive heart filter (black), and without applying the heart filter (dashed gray), are presented. While changes due to arterial pulsation are visible in some graphs, no significant changes with the fast signal periodicity are present.

