
Figure 3.
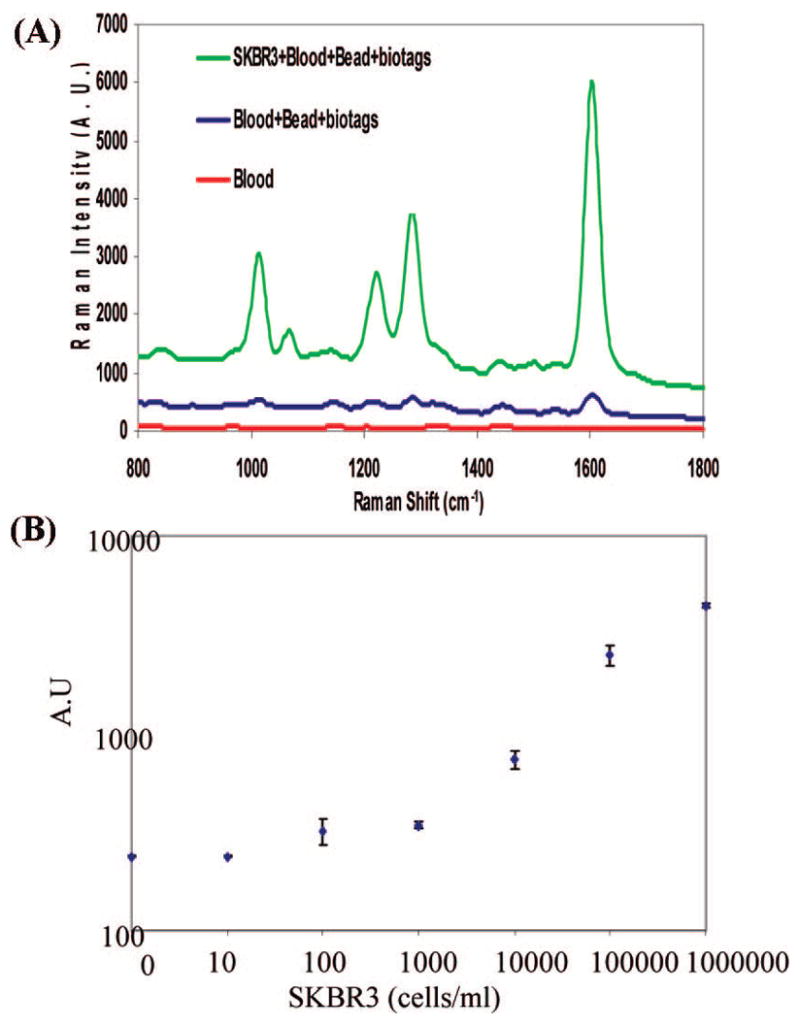
(A) Detection of SKBR3 spiked into whole blood. Raman spectra of whole blood (red) and of beads and biotag reagents in blood without a cell spike (blue) and with SKBR3 cells spike (green). (B) Dose–response curve of SKBR3 cells spiked into whole blood. Blood with no cell spike was used as a negative control.