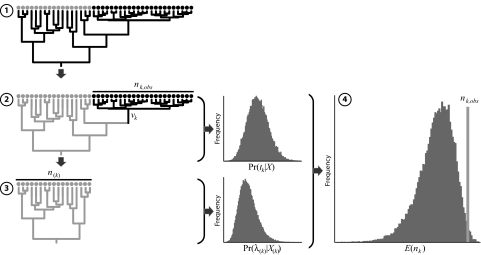
Fig. 1.
Evaluating correlates of differential diversification rates using cross-validation predictive densities. Step 1 involves estimating the joint posterior probability density of the phylogeny and divergence times from the entire data set of nucleotide sequences. In step 2, the history of the event is estimated from the resulting posterior probability distribution of trees. Step 3 entails constructing the training data partition by removing the subset of species associated with the event and then subjecting this reduced data set to a second round of phylogeny/divergence-time estimation. Finally, we draw from the marginal posterior densities of tk and λ(k) (estimated in steps 2 and 3, respectively) to generate the cross-validation predictive diversity density (using Eq. 3), which permits us to assess whether the realized species diversity is significantly higher or lower than predicted (using Eq. 4).

