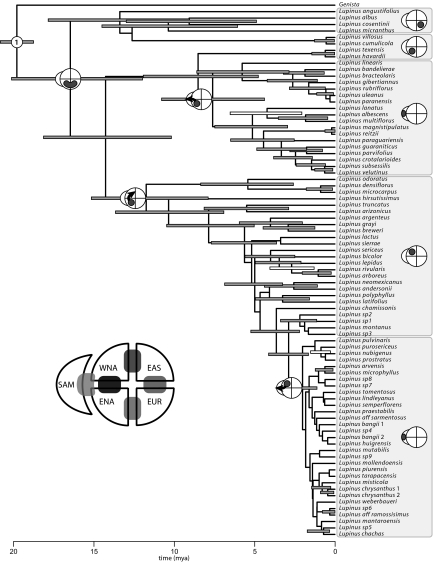
Fig. 4.
Dated phylogeny for Lupinus based on a Bayesian analysis of the combined data set. Uncertainty in the tree topology and divergence times are indicated by bars on internal nodes: their length corresponds to the 95% highest posterior density (HPD) of node ages, and their shading reflects the posterior probabilities of nodes (shaded bars, nodal posterior probabilities ≥0.90; open bars, those <0.90). The numbered internal node corresponds to the fossil constraint used to estimate divergence times (Table S2). Observed species ranges are indicated across the tips of the tree, and the diagrams adjacent to internal nodes indicate the inferred locations of biogeographic dispersal events, including 2 into South America.

