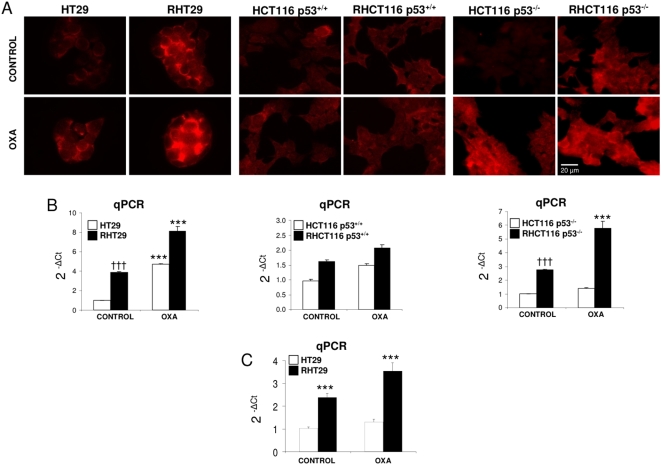
Figure 3. MMP7 shows a higher expression in the oxaliplatin resistant cell lines.
A) Immunofluorescence (IF) staining of MMP7 in the non-resistant (HT29, HCT116 p53+/+, HCT116 p53−/−) and resistant cells (RHT29, RHCT116 p53+/+, RHCT116 p53−/−). MMP7 is strongly upregulated in the RHT29 and RHCT116 p53−/− cell lines and its expression is also increased by oxaliplatin treatment. Levels of MMP7 were also analyzed by qPCR both in vitro (B) and in vivo (C) obtaining a similar pattern than in the IF assay. Results represent the mean±SEM for 6 samples in each group. Values that are significantly different between control and treated group by ANOVA analysis are indicated by *p<0.05,**p<0.001,***p<0.0001, and between different cell lines †††p<0.0001. OXA: oxaliplatin.

