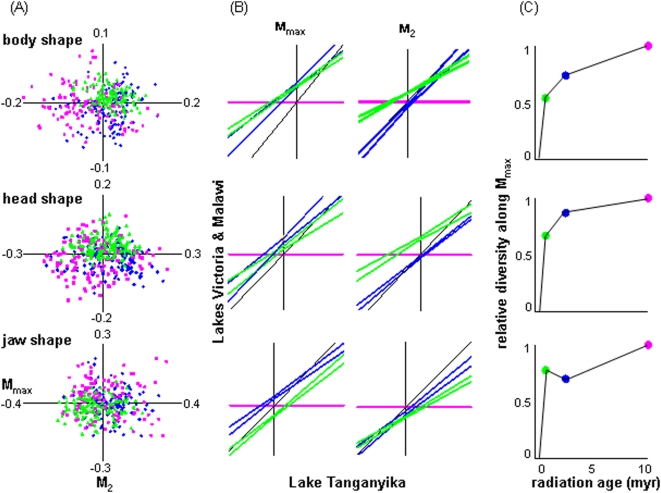
Figure 3. Morphological diversity in the common morphospace.
Variation in body, head and jaw shape diversity in common morphospaces among the cichlid assemblages from Lakes Victoria (LV-green), Malawi (LM-blue) and Tanganyika (LT-pink). (A) Locations of species of the three assemblages in the three morphospaces. (B) Ordered-axis plots along Mmax and M2 (with LT along the x-axis) showing the 99.99% confidence intervals of linear regressions of LV and LM on LT. Non-equal intercepts show assemblages are centered at different locations along the axis. Non-equal slopes indicate the assemblages have different levels of diversity along the axis. See Table 1 for tests of equality for the intercepts and slopes. (C) The relationship between assemblage age and relative morphological diversity (slopes of the regression of LV and LM on LT from the ordered-axis plots, with LT = 1 ) along the three Mmax axes. For these plots the approximate ages of the assemblages are: LV-0.1 myr., LM-2 myr., LT-10 myr. Note that the lines connecting the points are included for comparison, not to imply temporal trends in diversity of a single radiation.

