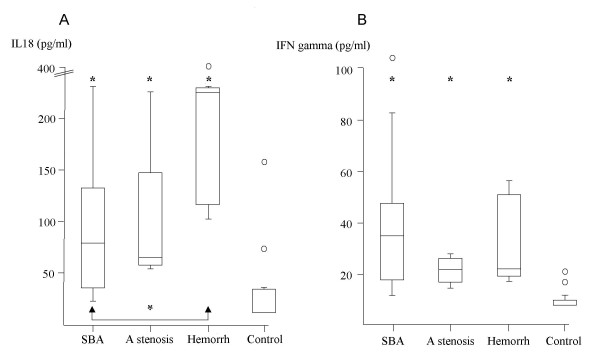
Figure 1.
(A) Graphs of CSF interleukin-18 (IL-18) concentration and (B) CSF interferon gamma (IFN gamma) concentration in CSF from neonatal HPHC. The vertical axes indicate concentration (pg/ml). The horizontal axes indicates three different age-matched aetiologies for neonatal HPHC: spina bifida aperta (SBA), aqueduct stenosis (A stenosis), and fetal intracranial hemorrhage (Hemorrh) and neonatal controls (Control). Data are median and range plus 25th and 75th percentiles Encircled symbols in the figures indicate single parameters that appeared out of range. A: In all three neonatal HPHC groups, IL-18 concentrations were significantly higher than in controls (* p < 0.01). Furthermore, the fetal intracranial hemorrhage hydrocephalus group was significantly higher than the SBA hydrocephalus group (indicated by arrows at the bottom * p < 0.01). B: In all three neonatal HPHC groups, CSF IFNγ concentrations were significantly higher than in controls (* p <0.01).

