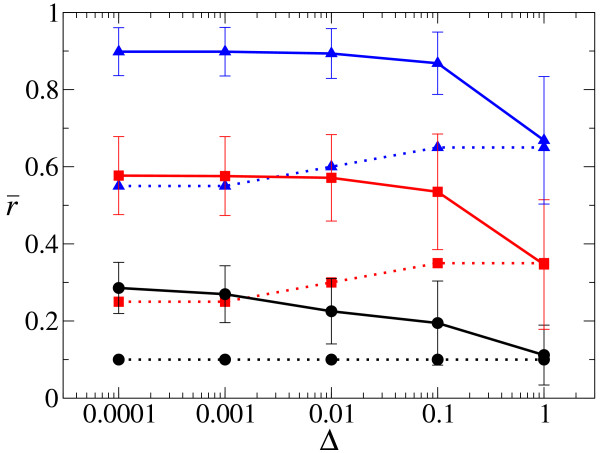
Figure 10.
The evolution of strand preference (r) as a function of the diffusion intensity (Δ) in the system with complex formation. Solid lines represent the evolved value of as a function of the diffusion intensity (Δ) for various decay rates (d). Dashed lines represent the minimum value of r necessary to ensure system survival (rmin). Colors (and simbols) represent the value of d: d = 0.0025 (black circles); d = 0.0125 (red squares); d = 0.025 (blue triangles). The other parameters are as follows: kSP = kSM = kDP + kDM = 1; b = 1; κ = 1; μ = 0.01; δr = 0.1.

