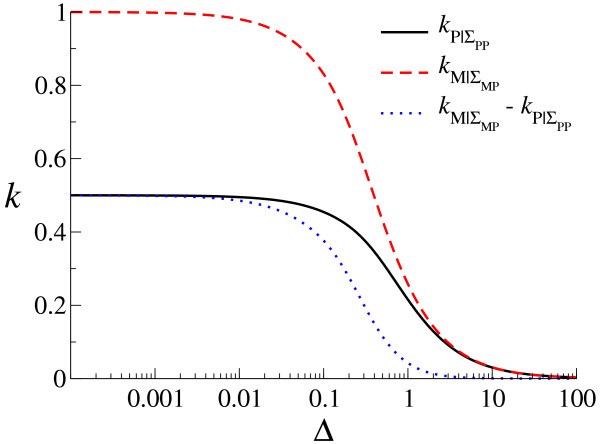
Figure 4.
Advantage of producing (-) strands. The value of = (1 - e-(Δ+2a)τ)a/(Δ + 2a) (black solid line), that of = (1 - e-(Δ+a)τ)a/(Δ + a) (red dashed line) and the difference thereof (blue dotted line) are plotted as a function of Δ (τ is set to Δ-1), with a = 0.5 [a is the rate of replication for single stranded templates – either (+) or (-) strands]. For those plotted values to be applicable to the CA model, a should lie between 0.1kS and kS where kS = kSP = kSM. This is because in the CA model the number of neighbors are 8 (rather than 2), and these 8 neighbors are not necesarily all P. Thus, to calculate values corresponding to and in the CA model, one must also factor in the probability that a molecule (P or M) interacts with P given that they are in the neighborhood of the molecule (see Methods for the details of how interactions are implemented in the CA model).

