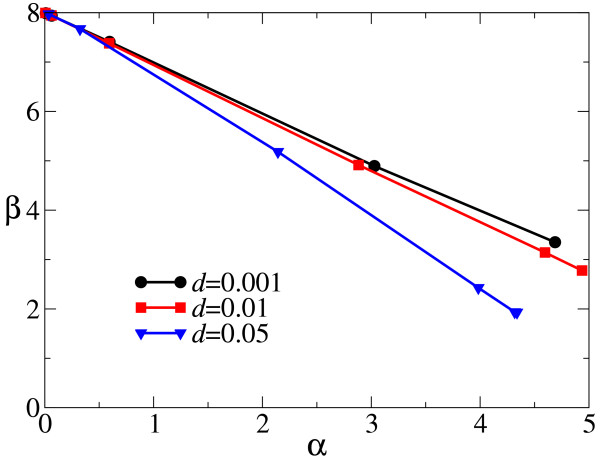
Figure 6.
Relationship between the critical degree of aggregation (α) and the sensitivity of correlation to the density of observed replicators (β). α and β are calculated as, respectively, the intercept and slope of the linear regression to for intermediate values of q for which is approximately linear to q (see Fig. 5). Values of d are as shown in the plot. For the same value of d, several data points are plotted for different values of Δ (from right to left, Δ = 0.0001, 0.001, 0.01, 0.1, 1, 10; points are almost on top of each other for Δ = 1 and 10). The other parameters are the same as in Fig. 5. Note that α can also be calculated from since has almost the same slope as that of , as shown in Fig. 5. Also note that when α ≈ 0 (i.e. when Δ ≫ 1), β becomes almost 8 because the current CA model uses Moore (8) neighbors.

