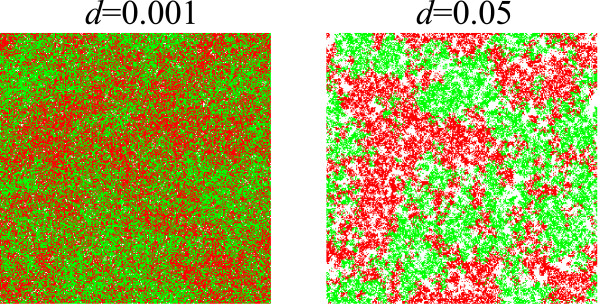
Figure 8.
The effect of decay on the spatial distribution of replicators. Snapshots of simulations show a spatial distribution of replicators for different decay rates (d). The two colors represent two different "species", which have identical parameters (see "Multi-scale analysis of the model" under Results for more details). The intensity of diffusion (Δ) is 0.01. The other parameters are the same as in Fig. 5. The snapshots are taken when the frequency of two species is almost fifty-fifty. This figure shows that a greater decay rate (shorter longevity) of replicators leads to a greater spatial correlation within the same species.

