Figure 2.
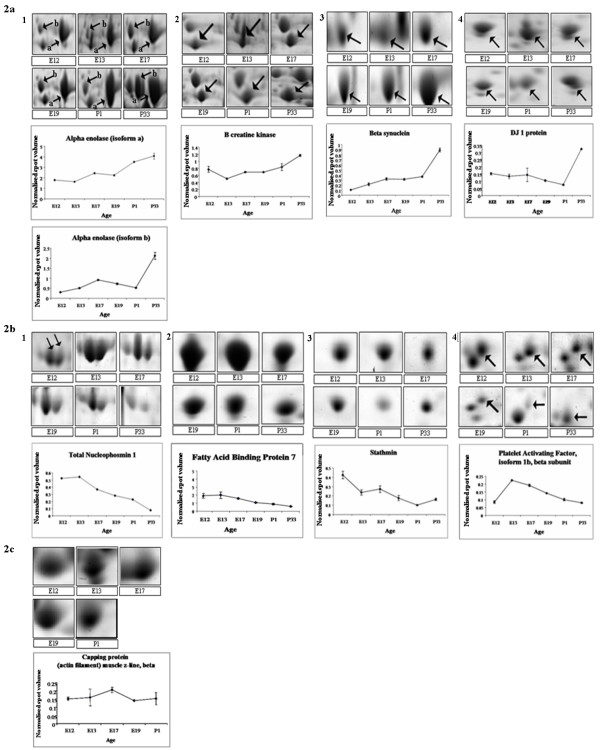
a Representative 2D montage images showing protein expression changes from E12, E13, E17, E19, P1 and P33 chick retina. Shown in the gel montage images are proteins which displayed a general increase in expression between E12 and P33 (Adult/A type proteins) together with graphical representation of the change in protein expression. The vertical axis shows spot normalized volume and each point on the line graph represents the average spot abundance expressed as normalized volume ± SEM,n = 3). For clarity, where there is more than one spot in an image arrows indicate the spots that were identified by MS: (1) Alpha Enolase (spots 2, 3 and 4 in Table 2), (2) B creatine kinase (spot 6, Table 2), (3) Beta synulcein (spot 8, Table 2) and (4) DJ1 Protein (spot 10, Table 2). b Representative 2D montage images showing protein expression changes from E12, E13, E17, E19, P1 and P33 chick retina. Shown in the gel montage images are proteins which displayed a general decrease in expression between E12 and P33 (Juvenile/J type proteins) together with graphical representation of the change in protein expression. The vertical axis shows spot normalized volume and each point on the line graph represents the average spot abundance expressed as normalized volume ± SEM,n = 3) For clarity, where there is more than one spot in an image arrows indicate the spots that were identified by MS: (1) Nucleophosmin 1 (spots 1a & 1b, Table 2), (2). FABP7 (spots 7a & 7b, Table 2), (3) Stathmin 1 (spot 9, Table 2) and (4) Platelet activating factor (spot 5, Table 2). c. Representative 2D montage images showing protein expression changes from E12, E13, E17, E19, P1 and P33 chick retina. Shown in the gel montage image is a protein which displayed a transient change in expression during retinal development together with graphical representation of the change in protein expression. The vertical axis shows spot normalized volume and each point on the line graph represents the average spot abundance expressed as normalized volume ± SEM,n = 3): capping protein (spot 12, Table 2).

