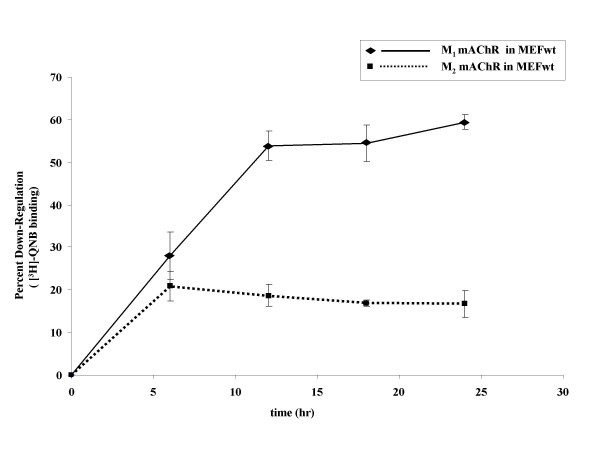
Figure 1.
Time-course of agonist-promoted down-regulation of mAChRs in MEF. MEF wt cells were transfected with eGFP-M1 (◆) or HA-M2 (■) mAChR. 24 hr following transfection, cells were treated with 1 mM carbachol for the indicated time. Down-regulation was determined using [3H]-QNB binding (fmol/mg protein) in crude membranes as described in methods. The M1 mAChR displays nearly threefold the down-regulation of the M2 subtype over the same time course. Data are expressed as percent down-regulation compared to t = 0 control and are presented as mean ± standard error of the mean for three independent experiments with duplicate data points. Total mAChR expressed (fmol/mg) at t = 0 was 4000 for both M1 and M2 mAChRs.

