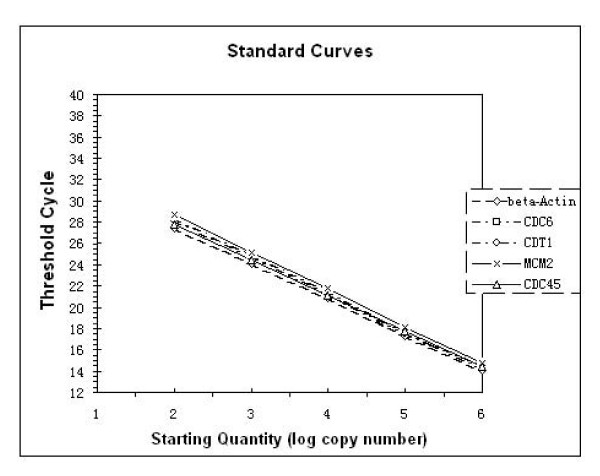
Figure 1.
CDC6, CDT1, MCM2, CDC45 and β-actin standard curves. SYBR GREEN I standard curves for CDC6, CDT1, MCM2, CDC45 and β-actin were obtained by amplifying five serial dilutions of standards known concentration (102–106). The linearity of the plots shows the coefficient of correlation for five genes. R2 > 0.994.

