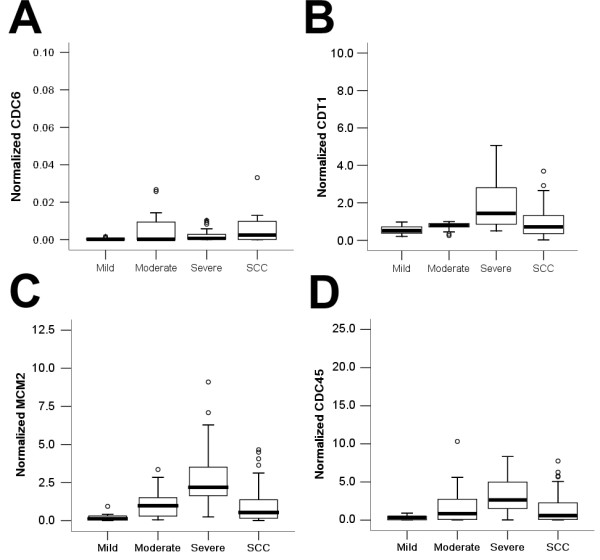
Figure 2.

Box plots for the normalized expression levels of CDC6 (A), CDT1 (B), MCM2 (C) and CDC45 (D) in mild, moderate and severe epithelial dysplasia and tongue SCC. The box represents 50% quartiles (above 25% and below 75%) and the solid line within each box is the median gene expression value. The small circles represent the outliers.
