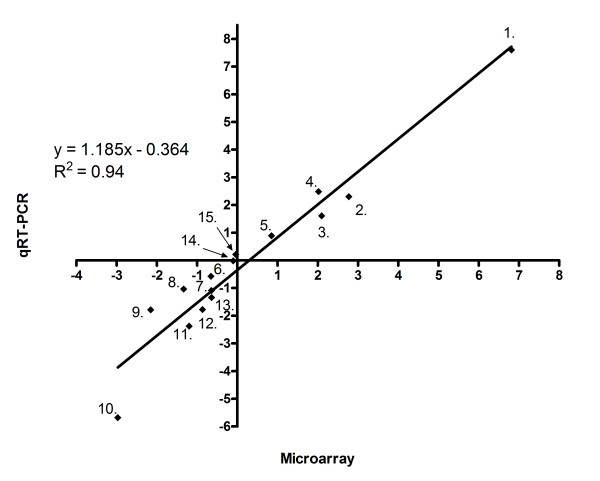
Figure 2.
Microarray results validation by qRT-PCR. Five up-regulated genes, eight down-regulated genes and two non-differentially expressed genes are presented. Mean log2 ratios of the qRT-PCR experiments are plotted against the mean log2 ratios of the microarray experiments. Numbers on the graph refer to genes listed in Table 3.

