
Figure 3.
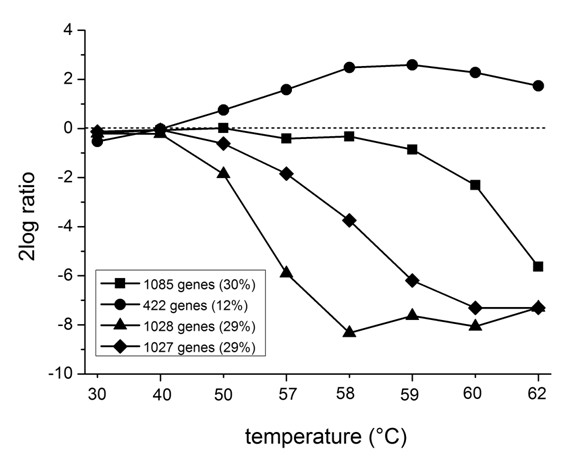
K-means clustering of genome-wide expressiondata. Expression profiles were analyzed by the use of K-means clustering-classifying the data set into 4 clusters – showing the global behaviour of gene transcripts during the heat exposure from 30 to 62°C. The 8 data sets include the temperature exposures (from left to right) of 30, 40, 50, 57, 58, 59, 60, and 62°C.