
Figure 6.
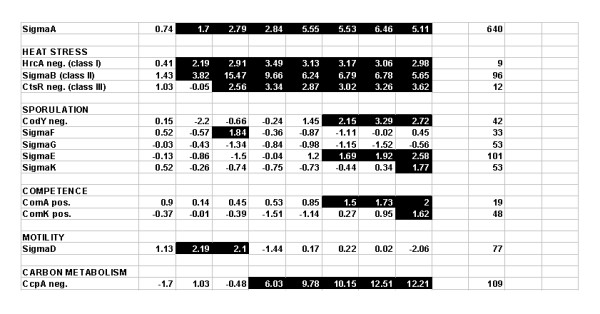
T-profile analysis of transcription regulons. Transcription profiles for each temperature condition were analyzed by the use of the T-profiler, a tool that uses the t-test to score changes in the average activity of predefined groups of genes [16]. Group definitions were obtained from the DBTBS: the database of transcriptional regulation in B. subtilis, release 4.1 [18]. A total number of 9 categories were displayed as function of temperature (the 8 samples from 30–62°C as in Figure 1A). T-values ≥ 1.5 are indicated in black (arbitrarily selected T-value). The right column indicates the total number of genes of the regulon included in the analysis.