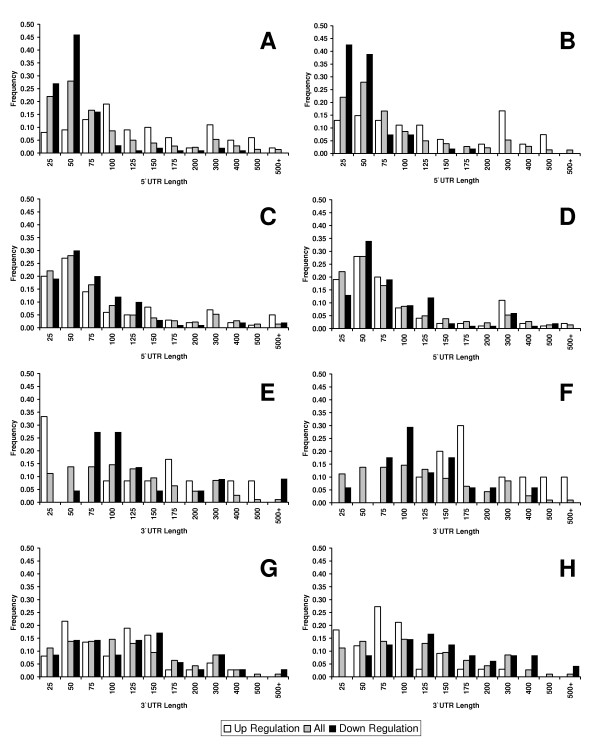
Figure 6.
Histograms of UTR lengths for translationally controlled gene sets. The 5' UTR lengths are shown for gene sets that are up- or down- regulated under varying stress conditions. A. Amino acid starvation, B. Butanol addition, C. 0.2 mM H2O2, D, 2 mM H2O2., along with 3' UTR length distributions for gene sets under E. Amino acid starvation, F. Butanol addition, G. 0.2 mM H2O2, and H, 2 mM H2O2

