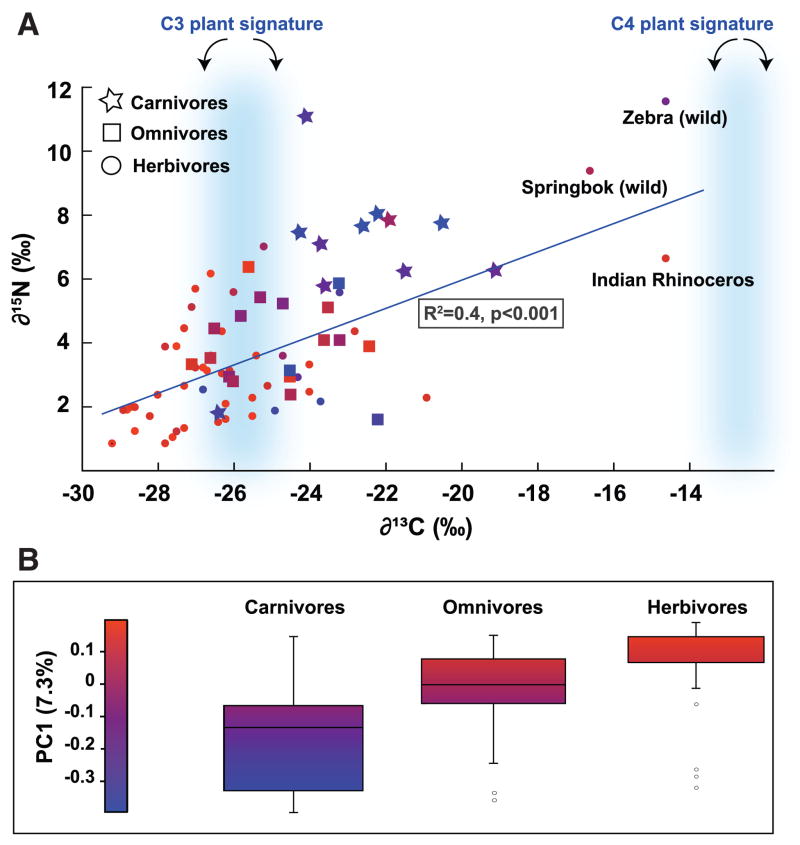
Figure 3. Markers of trophic level mapped onto the variance in fecal microbial community diversity.
(A) Stable isotope values for C and N plotted for each fecal sample, presented according to diet group. Symbols are colored according to their PC1 value: PC1 is the first principal coordinate of the PCoA of the unweighted UniFrac metric. δ13C ranges for C3 and C4 plants are highlighted in blue. R2 is for δ13C versus δ15N. (B) Box plots are shown for the three diet groups (central line is the mean; box outline equals 1 S.D.; the bar denotes 2 S.D.; circles are outliers). The majority of fecal δ13C values are intermediate between the average for C4 plants (−12.5%) and C3 plants (−26.7%).

