
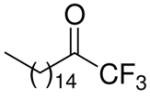
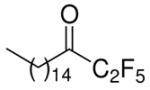
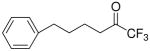
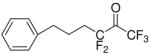
Table 1. Inhibition of PLA2 by fluoroketones.
Average percent inhibition and standard error (n=3) reported for each compound at 0.091 mole fraction. XI(50) values determined for inhibitors with greater than 90% inhibition. N.D. signifies compounds with less than 25% inhibition (or no detectable inhibition).
| No | Structure | GIVA cPLA2 | GVIA iPLA2 | GV sPLA2 | |||
|---|---|---|---|---|---|---|---|
| % Inhibition | XI(50) | % Inhibition | XI(50) | % Inhibition | XI(50) | ||
| 6 |
|
96 ± 2 | 0.0223 ± 0.0023 | 92 ± 3 | 0.0195 ± 0.0053 | 79 ± 9 | |
| 11 |
|
N.D. | 50 ± 13 | 43 ± 8 | |||
| 8 |
|
38 ± 2 | 96 ± 3 | 0.0096 ±0.0008 | N.D. | ||
| 10a |
|
N.D. | 98 ± 16 | 0.0073 ± 0.0007 | 28 ± 1 | ||
| 12a |
|
62 ± 5 | 96 ± 6 | 0.0025 ± 0.0003 | 48 ± 6 | ||
| 10b |
|
56 ± 4 | 98 ± 5 | 0.0065 ± 0.001 | 46 ± 8 | ||
| 12b |
|
68 ± 6 | 99 ± 10 | 0.0018 ± 0.0005 | 53 ± 14 | ||
| 10c |
|
65 ± 12 | 98 ± 4 | 0.0065 ± 0.0008 | 75 ± 10 | ||
| 19a |
|
91 ± 2 | 0.0199 ± 0.0025 | 85 ± 4 | 0.0328 ±0.0035 | 82 ± 8 | |
| 20a |
|
92 ± 3 | 0.0098 ± 0.0006 | 91 ± 4 | 0.0169 ±0.0021 | 86 ± 2 | |
| 19b |
|
96 ± 2 | 0.0156 ± 0.0019 | 94 ± 8 | 0.0208 ±0.0032 | 80 ± 6 | |
| 20b |
|
95 ± 2 | 0.0116 ± 94 ± 8 | 94 ± 8 | 0.0166 ±0.0022 | 84 ± 7 | |
| 23 |
|
88 ± 1 | 71 ± 14 | 49 ± 12 | |||
| 21 |
|
73 ± 4 | 95 ± 5 | 0.0075 ±0.0011 | 86 ± 4 | ||
| 30 |
|
27 ± 3 | 49 ± 12 | 59 ± 12 | |||
| 26 |
|
94 ± 2 | 0.0167 ± 0.0018 | 93 ± 4 | 0.0011 ± 0.0002 | 86 ± 10 | 0.0236 ± 0.004 |