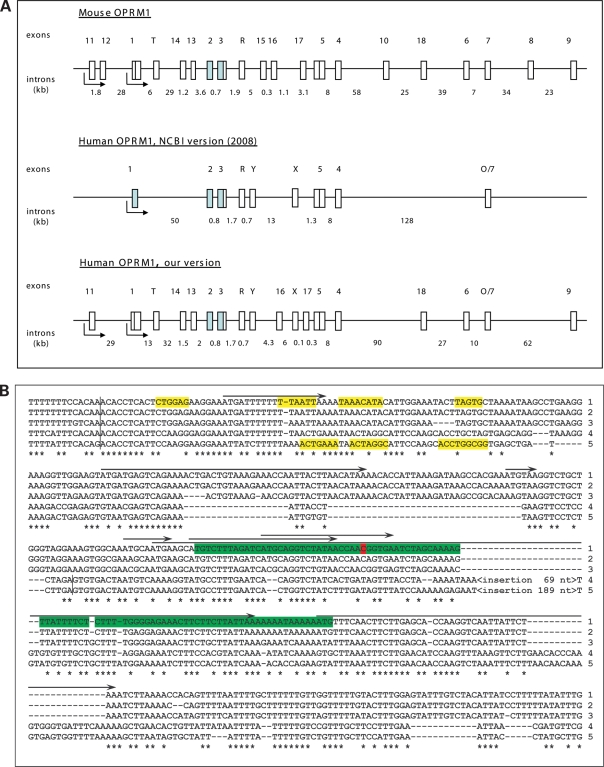
Figure 1.
The structure of the human and mouse OPRM1 gene. (A) Conventional structures of the mouse (upper panel) and human (middle panel) OPRM1 genes are shown in accordance with the NCBI database, UCSC genome browser and published data (43,76,77). Our version of the structure of the human OPRM1 gene (lower panel) is based on multispecies genome alignments created by OWEN (36) and comparative genomes analysis. Exons and introns are shown by vertical and horizontal boxes, respectively. Shaded boxes represent constitutive exons. Maximal sizes of human exons (for lower panel) are shown in parentheses (nt): exon 11 (206), exon 1 (580), exon T (117), exon 14 (105), exon 13 (1200), exon 2 (353), exon 3 (521), exon R (488), exon Y (109), exon 16 (314), exon X (1271), exon 17 (128), exon 5 (1013), exon 4 (304), exon 18 (412), exon 6 (124), exon 7 (89), exon 9 (393). (B) Alignment of human (1), chimpanzee (2), macaca (3), rat (4) and mouse (5) exon 13 and its conserved vicinity regions. Splicing boundaries are indicated by vertical bars. Enhancers of splicing (39) near exon–intron boundaries are marked in yellow. SNP rs563649 is highlighted in red. Conserved nucleotides for all species are marked by stars. Structurally conserved IRES in the human sequence is marked by green. Predicted uORFs in the human sequence are marked by arrows.

