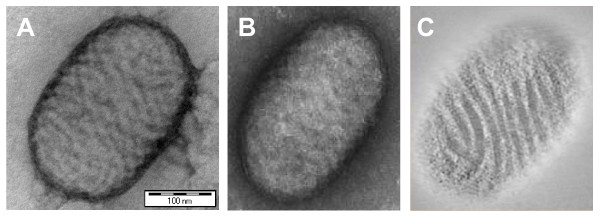
Figure 1.
Negative staining and electron tomographic analysis of Orf parapoxvirus. Figure 1A and B represent micrographs of uranyl acetate-stained particles of M-type and C-type Orf parapoxvirus characterised by obvious and hardly visible surface threads, respectively. Figure 1C is a 44-nm thick digital section taken along the Z-axis of the tomogram of the C-particle shown in B. A, B and C are represented with the same scale. Bar: 100 nm.

